Linux Networking Basics
A Short Guide for a Short Course
Michael Marsh
Contents
- Preface
- Chapter 1 Introduction
- Chapter 2 Network Overview
- Chapter 3 Connecting Hosts
- Chapter 4 Interactions Between Layers
- Chapter 5 Network Programming
- Chapter 6 Traffic
Preface
This book is intended as a companion for the University of Maryland course CMSC389Z, which is a three-week Winter Term course on Network Management and Programming in a Linux Environment. While it may be helpful outside of that context as a general introduction to some computer networking concepts, it is not meant to be anywhere close to complete.
Chapter 1 Introduction
This book was written as the text for a 3-week course Network Management and Programming in a Linux Environment at the University of Maryland. The material is very focused on the topics for this course, so there will necessarily be a lot that is omitted, both in breadth and depth.
1.1 Terminology and References
Before we get into any details, let’s begin by defining some terms:
- host – This is a computer, phone, or any other device connected to a network. We use this as a general term for anything on the network.
- network interface – This is something on a host that provides it access to a network. Every host will have at least one of these.
- device – This is another name for a network interface. Often used because it is shorter.
- traffic – This refers to data sent over a network. It will consist of many packets implementing various protocols.
- packet – This is a discrete unit of traffic. The network operates by moving individual packets from their sources to their destinations.
- protocol – This is a set of messages and rules that hosts use to meaningfully communicate. Protocols tell hosts how to “speak” to other hosts in a way that they will understand, and how to interpret those messages.
- network edge – This is the set of hosts that exchange data. Your phone and laptop, as well as the web servers you connect to, are all part of the network edge. There is some network infrastructure that is also considered part of the edge, such as your Wifi router.
- network core – This is the set of hosts that provide service for the network edge. These are owned and managed by large Internet Service Providers, and consist of routers (which we’ll see in Section 3.6), switches (which we won’t discuss, but bear some similarity to routers), and some other miscellaneous devices.
We’ll introduce other terms as needed, but these are the fundamental building blocks of any discussion of networking. We’re going to focus on hosts at the edge of the network, rather than the core.
You may find the following references helpful, both of which are available for free from https://www.cs.umd.edu/\( \sim \)mmarsh/books.html:
- Using the Bash Command Line – including common command-line utilities and scripting
- A General Systems Handbook – including numeric representations, git, Linux system administration, and networking commands
If you plan to do more network programming in C, the following references might be worth the investment:
- TCP/IP Sockets in C, by Michael J. Donahoo and Kenneth L. Calvert
- TCP Illustrated: The Protocols, Volume 1, 2nd Edition, by Kevin R. Fall and W. Richard Stevens
- UNIX Network Programming: Networking APIs: Sockets and XTI, Volume 1, by W. Richard Stevens
1.2 Some Linux Basics
You should familiarize yourself with Using the Bash Command Line, especially Chapters 1 through 3, 5, 7, and 9. You will likely want to refer back to these chapters frequently until you’ve internalized most of the information. Chapters 2, 3, and 5 of A General Systems Handbook will also be very useful, though we will expand on the material in Chapter 5 (Network Commands) in this book.
Another important thing to note when using Linux is how files encode
line endings. There are two common ASCII characters used to indicate
the end of a line: carriage return (\r) and newline
(\n). Newline is also sometimes called line feed. You will see
these abbreviated to CR in LF in much documentation. With two different
characters (representing different functions on a typewriter), what do you
use, and where?
This is where things get complicated. On Linux, line endings use newline
(LF). Macs also use newline now, but used to use carriage return (CR). Windows uses a carriage return followed by a newline (CRLF). The CRLF
encoding is also used by ASCII-based network protocols, like HTTP.
Why do we care about this, when this is a Linux-focused course? Because many students use Windows computers, their file editing
software will produce files with CRLF line endings. Some programs,
like the C compiler, handle these different encodings without
problems. Others, like the bash shell, insist on LF line
endings. There is a helpful utility, called dos2unix, that you
should install in order to convert files. If you are writing a bash
script, make sure you use dos2unix to ensure that it has the correct
line endings.
1.3 Course Structure
For the three-week course, the weeks will cover:
Chapter 2 Network Overview
In this chapter, we will explore the design of the network and the tools used to configure and examine it. We will begin with the high-level network model, then how pairs of hosts are connected, and finally how these are combined into a large distributed system.
2.1 The OSI Model
To understand the design of the network, it is important to familiarize ourselves with the Open Systems Interconnection (OSI) Model. In this model, we create multiple layers, each of which is reponsible for a particular type of service. These layers provide Application Programming Interfaces (APIs) to the layers above and below them.
Within a layer, we define and implement various protocols to handle that layer’s responsibilities. These protocols must adhere to established APIs, so that one protocol at a layer can be replaced with another without impacting the rest of the layers.
By organizing the protocols in this manner, we gain an abstraction of the network. We like abstractions, because they allow us to reason about individual components of a complex system, as well as replace pieces that no longer suit the needs at that layer.
The OSI Model divides the network stack into seven layers:
- Physical
This is how hosts and other devices are actually connected. Physical layer devices include ethernet cables, RF antennas, fiber optic cables, etc. It also includes how bits (or groups of bits) are encoded on those connections (voltages, durations, etc.).
- Datalink (or just Link)
This defines how devices group collections of bits into messages, called frames, each with a specified source and destination. Ethernet and WiFi are examples of Link layer protocols. A network at this layer is generally referred to as a subnet or local network.
- Internetworking (or just Network)
This defines how local networks are connected in a way that allows for world-wide communications. A single Network layer message, called a packet, might be comprised of one or multiple Link layer frames, but a single frame may only contain a single packet’s data. Most of the time when we talk about the Network layer, we are talking about version 4 of the Internet Protocol. When looking at a particular portion of the network, we often refer to subsets of it as subnets, even if we are still referring to the Network layer.
- Transport
The Network layer only defines host-to-host connections. The Transport layer adds multiplexing through at addition of ports, to support process-to-process connections. That is the only thing that the User Datagram Protocol (UDP) does, but the Transmission Control Protocol (TCP) adds reliability and in-order packet delivery as well.
- Session
Some protocols require using multiple Transport layer connections, either on different ports of a single host or to different hosts. When this is required, the Session layer coordinates these.
- Presentation
This layer handles data encoding and decoding, so that the data as sent “on the wire” is readable by the application, and vice-versa.
- Application
This is where users interact with the network, through an interface such as a web browser. There are many Application layer programs, both graphical and command-line-based.
The Session and Presentation layers are often omitted from networking
discussions, because they are used either less frequently or so
transparently that they appear to be missing or part of another layer. We will limit our discussion of these two layers by noting (this will
make more sense later) that the Session layer often appears in applications
such as Voice-over-Internet-Protocol (VoIP) which require coordination between
multiple Transport-layer protocols, and the Presentation layer is often
captured in functions such as htonl.
We typically characterize connections between hosts with several quantities:
- Bandwidth This refers to the speed at which data can be written to
and read from the connection. It is typically given in terms of bits per
second (
bps), with powers-of-10 prefixes such as kbps (\( 10^3 \)bps), Mbps (\( 10^6 \)bps), and Gbps (\( 10^9 \)bps). Note that the typical byte is an octet (8 bits), so you need to divide by 8 to obtain bytes per second, and bytes are usually expressed in powers-of-2 prefixes. - Latency This refers to the time it takes for a single bit written at the source to reach the destination. It is often given in milliseconds, but can be considerably longer.
- Bit-Error Rate All physical media are imperfect, and this refers to the average fraction (possibly, but not always, given as a percentage) of bits transmitted that are either flipped or undiscernable at the destination. It is often abbreviated BER. This does not include losses of data due to overwhelming the network with more data than it can handle.
- Throughput This refers to how quickly we can move data from its source to its destination. The most we could ever achieve is the connection bandwidth, but this is rarely attainable. It is often helpful to consider throughput for a specific layer, in which case the overhead of the lower layers reduces the throughput relative to the bandwidth by predictable amounts.
- Goodput This refers to practical application-layer throughput (the good throughput), which is what applications (and users) see.
2.2 Internet Protocol
The Internet Protocol (IP) has two major versions: IPv4 and IPv6. We will focus on IPv4, but where appropriate we will provide analogous IPv6 information. IP is a layer 3 (Internetworking) protocol, as you might guess from its name.
The purpose of IP is to forward data across a global network. This requires unique addresses for all hosts on the network (though we will see how this requirement can be loosened).
At layer 3, data is divided into packets. A packet has a header and a payload. The payload is the actual data we are interested in delivering, while the header provides sufficient information to move the packet through the network.
IP performs two crucial functions: routing and forwarding. Routing involves distributed protocols that allows participants to create routing tables (also called forwarding tables). Forwarding is the method by which an IP participant determines what to do with a given packet: Is this the destination? Should the packet be forwarded, and to whom? Should the packet be discarded (dropped)?
Hosts that perform routing and forwarding are called routers (because they route traffic). These are only required to implement OSI layers 1–3, though many provide extra functionality for remote administration or run on general-purpose computers. End-hosts (such as your laptop, phone, smart thermostat, or even some lightbulbs) can only be the source or destination for a packet — they do not normally provide forwarding.
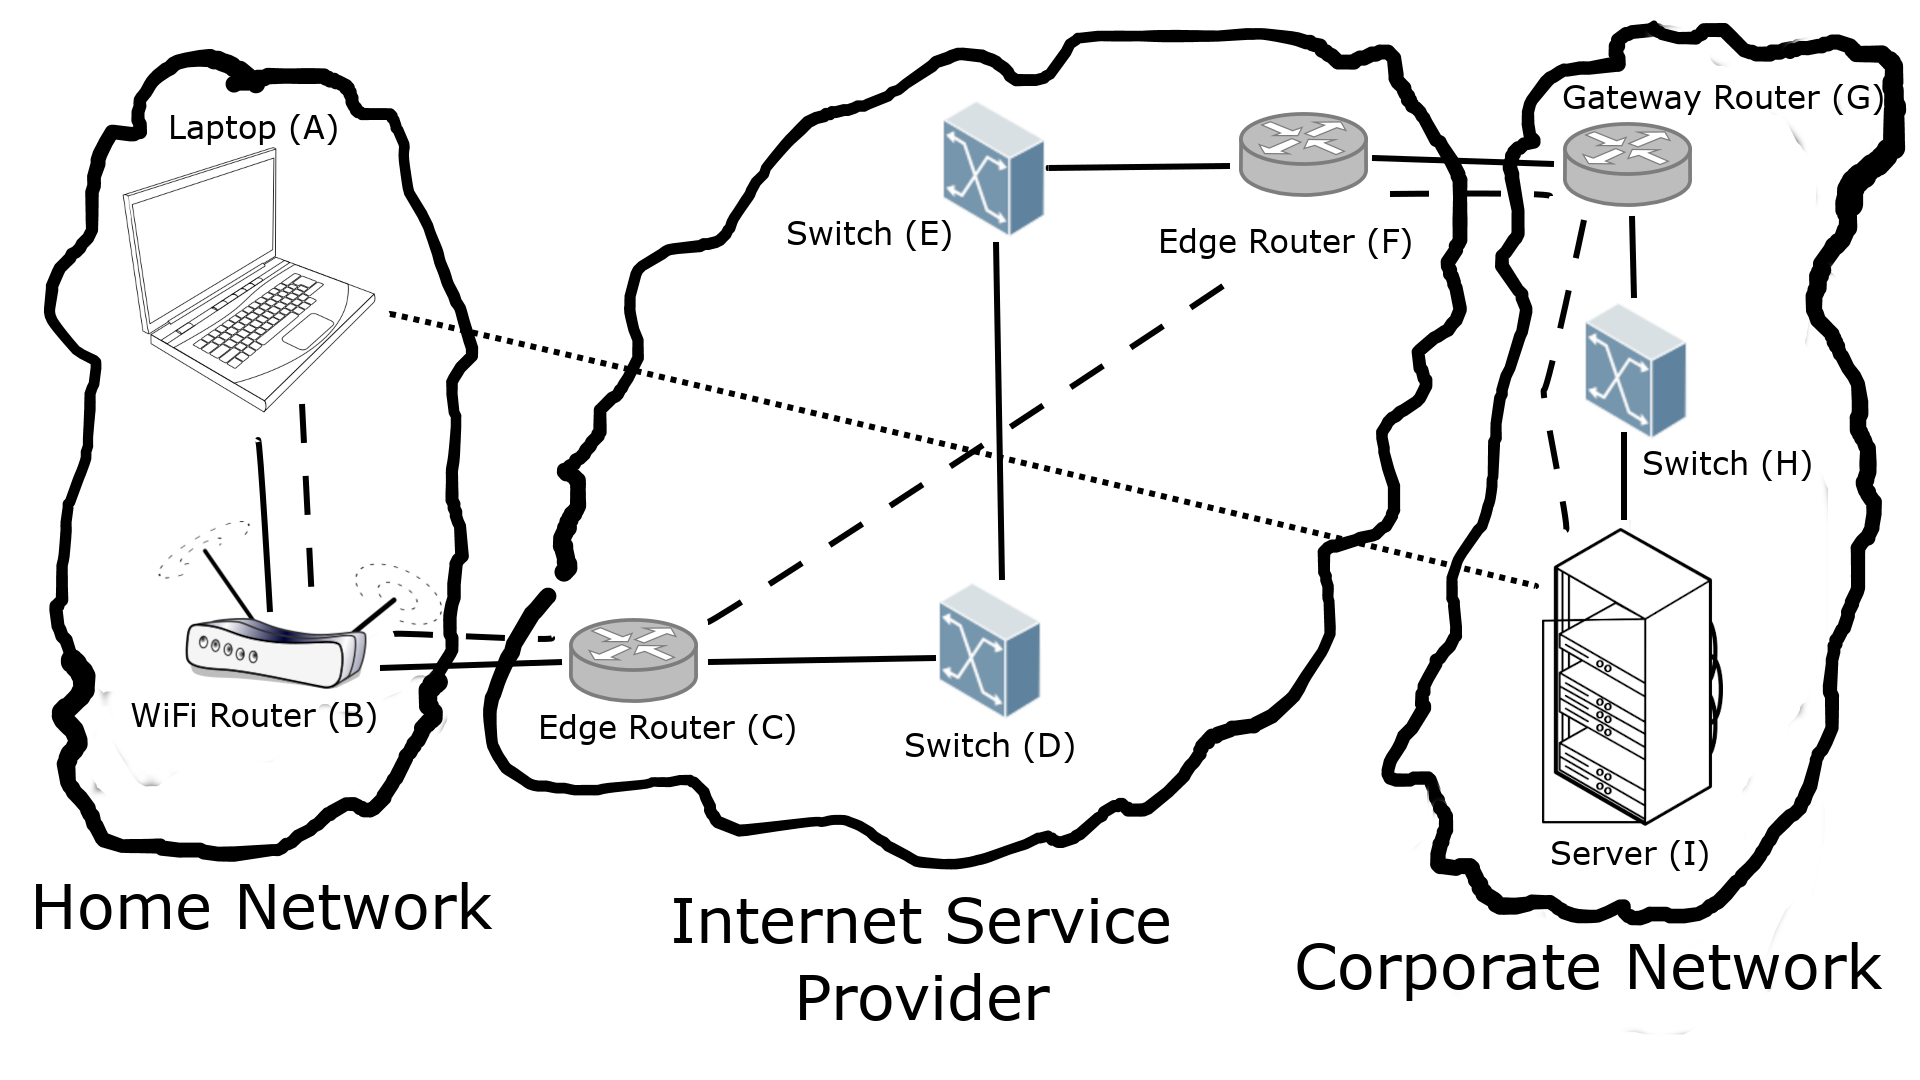
An example of network connection is shown in Figure 2.1. Here we have three networks: a typical home network on the left, an Internet Service Provider (ISP) network in the middle, and a corporate network on the right. Solid lines are layer 1 and layer 2 connections; there might be other layer 1 devices, like repeaters,1 that are not shown. Laptop A is connected via WiFi to a WiFi router B. From the home network’s perspective, this router is the gateway router (GW). This router is connected via Ethernet to an ISP edge router C. C is connected to switch D, which is in turn connected to another switch E. E is then connected to edge router F, which connects to the corporate gateway router G. In the corporate network, G is connected to a switch H, which connects to the server I in the data center. Dashed lines show the layer 3 connections, which we refer to as an overlay on top of layer 2; this only connects the end hosts and the routers. The dotted line is the layer 7 overlay on top of layer 3, where the only hosts are the laptop and server. The ISP will likely refer to B and G as customer edge (CE) routers, and C and F as provider edge (PE) routers.
2.3 Naming
Internet Protocol requires hosts to have unique names (with some
caveats). These names are 32-bit integers, or four bytes (usually
referred to as octets in networking, because there are 8 bits in
each). We generally write these in dotted-decimal notation, so while
it is perfectly valid to refer to a host’s address as 2148040452,
we would generally write it as 128.8.127.4.
How do we get the dotted-decimal form? If we write 2148040452 in
hexadecimal, it is 0x80087f04. An octet is two hexadecimal
characters, so breaking this down gives us 80 08 7f 04. If we then
write these hexadecimal values in decimal, with a dot between octets,
we get 128.8.127.4.
An IP network is divided into subnets that are managed by different authorities. We specify these subnets using Classless Inter-Domain Routing (CIDR) notation. A CIDR block comprises as base address and a prefix length, separated by a slash. The prefix length tells you how many bits in the base address specify the subnet. That is, any address with the same first prefix-length bits as the base address is part of the same network.
To make this clearer, let’s take a look at the subnet 128.8.0.0/16
(this is University of Maryland’s network). Here, the /16 (read
“slash-16”) tells us that the first two octets of 128.8.0.0 specify
the subnet. In this case, that’s the 128.8 part, so any IP address
beginning with 128.8 is part of this network.
Subnets can be subdivided further, and an individual host is sometimes
treated as a /32 CIDR block. Each subdivision of a network typically
denotes hosts that are physically closer together, though there are
cases where this is not necessarily true (such as with Virtual Private
Networks). Forwarding proceeds by moving a packet to the CIDR block
containing the destination address with the longest-possible prefix
length. The forwarding table tells a router which outgoing connections
can receive which CIDR blocks.
3.1 Transport Layer and Multiplexing
The simplest model for an end host is a computer with a single network connection. This might be an ethernet cable, a WiFi radio, or something else. If only one process on a host could access the network at a single time, we would not have much of the functionality that we currently rely on. This was, in fact, the case for many home computer users who used to use a telephone modem to dial into a bulletin board system (BBS). To get around this limitation, we need some way to multiplex connections over a single physical connection.
Layer 4, the Transport Layer, provides us with multiplexing through the use of ports. You can think of ports as an additional address within the computer that identifies not just a particular process, but a specific socket within a process. We will discuss sockets in more detail in Chapter 5.
For our purposes, we will only consider the two most common Transport Layer protocols for most applications: UDP and TCP. Each of these provides port-based multiplexing. These are not the only Transport Layer protocols, and there are even protocols that do not involve port-based multiplexing.
UDP is the User Datagram Protocol. UDP adds a very simple header with 16-bit port numbers on the source and destination side. The destination port enabled the destination host to pass the payload of the UDP packet, the datagram, to the appropriate process. While a single datagram can (but often does not) contain multiple application-layer messages, a single message must be contained within a single datagram. The sender port enables the receiving process to send a reply. Otherwise, UDP adds no additional functionality.
TCP is the Transmission Control Protocol. TCP has a much more complex header, which we will not discuss in detail here (see Chapter 6). For the moment, all that we care about is that, like UDP, it contains source and destination ports. In addition, it contains information that allows each end to determine when packets have been dropped, how fast data can be sent, and how to properly order the data received. Along with retransmission of dropped packets, this means TCP provides a reliable in-order data stream.
How do we decide which of these to use in an application? If we have reasonably short, self-contained messages, then UDP is often sufficient. The advantage of using UDP for these is that it has a much lower overhead cost than TCP. We can add our own reliability at the application layer, if we need it. If we have more continual data, then TCP is often a better choice, since we are guaranteed to have our data streamed to the application layer in the correct order with nothing missing, and taking maximum advantage of the network connection. However, we sometimes want to use UDP for streaming data. This typically occurs in applications where the loss of data is less important than timely delivery. Consider streaming voice: If we lose a packet, we have a very small amount of voice data that is lost, which might not even be noticeable. On the other hand, if we require the lost packet to be detected and retransmitted, we might end up with a very noticeable delay on the receiver’s side, which will only grow as additional packets are dropped and retransmitted.
To summarize:
- Simple single-message protocols are often best with UDP.
- Streaming data protocols where reliability is important are often best with TCP.
- Streaming data protocols where latency is important are often best with UDP.
3.2 netcat — Simple Data Exchange
You are hopefully familiar with the cat command, which reads data
from standard input or specified files and concatenates it to
standard output. There is a network version of this, called netcat. While you would not ordinarily use this to, say, browse the web, it
can be very helpful when testing a new protocol or implementation.
There are two programs commonly referred to as netcat: nc and
ncat. Which one you have installed depends on your operating
system. ncat is provided by nmap.org, as
source code or binary for most operating systems. The options differ
slightly, and even basic usage depends on which version you are using.
Let’s begin by using netcat as a simple web browser. Specifically, we are going to use it to do a search using Google for “netcat”. Here, the two versions are almost the same. Either of the following will work:
nc www.google.com 80
ncat www.google.com 80
Both of these connect to the host www.google.com on port 80 (the standard
port for HTTP), and then wait for input. Run one of these, and then type:
GET /search?q=netcat
and hit Enter or Return. You should see the raw HTML returned by
Google. Here we see the first difference: nc will exit immediately
after receiving the response, while ncat will wait for additional
input.
Netcat can operate as a client or a server. A server is a program that waits for connections requesting its service, and responds to them; a web server is probably the most familiar to people currently. The programs connecting to those servers are clients; think of a web browser. We will start with netcat as a client (as we did above), but first let’s look at some general options common to both client and server operation.
| Option | Meaning | Notes |
-4 |
Use only IPv4 | |
-6 |
Use only IPv6 | |
-u |
Create UDP connections | The default is TCP |
-v |
Verbose output |
We have seen some basic client operation already. The client behavior can be summarized as:
- Connect to a server.
- Send a message.
- Wait for a response.
The options we provide affect this behavior. We have already seen the
-u option, to make a UDP connection instead of a TCP connection. As
a client, you must always supply a hostname and a port
(www.google.com and 80, in our previous example). While there are
client-specific options, you are less likely to use them. See the manpage
for your particular version of netcat for details.
While it is possible to use netcat as a client generally, it is more useful
for debugging servers. Since many protocols are binary, you will often
want to store the messages to send in files, and redirect them using the
shell’s < operator:
nc example.com 1234 < message
This is also useful for text-based protocols, to save typing.
Just as running netcat as a client is useful for debugging servers, running netcat as a server can help you debug clients. It is also useful if you just need to capture messages from a client. We will see other ways to capture message in Chapter 6, but if all you need is the application-layer payload, a netcat server could be all that you need.
There are more options for running a server, and this is where the
differences between nc and ncat are more noticeable.
| Option | Meaning | Notes |
-l |
Listen for connections | Basic server option |
-p <port> |
Listen on port <port> |
Only for ncat, nc just takes the port as a regular option |
-k |
Keep the socket open | Don’t exit after the initial client disconnects |
Here are examples of how you would start a netcat server listening on port 1234:
nc -l 1234
ncat -l -p 1234
If you run either of these and then run (in a separate terminal)
nc 127.0.0.1 1234
you can type on one terminal and see it appear on the other. This
works in either direction. When you close one side (with Ctrl-C or
Ctrl-D), both sides will close.
3.3 Standard Ports and Services
There are a lot of common network protocols, such as HTTP, SMTP (email), SSH, and DNS. Whether they use TCP or UDP, these have standardized ports that all applications supporting those protocols should use by default. If you’re implementing one of these applications, you need to know these standard ports. Additionally, you might be logging attempted connections to your host, and want to know what possible attackers are attempting to connect to.
On Posix systems, such as Linux or MacOS, these standard ports are
enumerated in the file /etc/services. A typical line might look like
http 80/tcp www www-http # World Wide Web HTTP
The first column tells us the protocol, which in this case is HTTP
(Hypertext Transfer Protocol). The next column tells us the port (80)
and layer 4 protocol (TCP) for this service. The remainder of the line
contains common names for the service, with general comments following
the # comment character.
You are not likely to need to refer to this very often, but it is useful to know where to find this information if you need it.
3.4 Finding Active Ports
The typical modern operating system has a lot of services running that receive messages over the network. It also tends to send a lot of messages, both for user-initiated actions as well as background tasks. All of these employ network ports, so it is useful to be able to see what ports are in use.
The standard Linux command to view ports is netstat. Technically,
this shows the sockets that are in use, which can include local
(non-network) sockets. The simplest usage is
root@efcc0d32f10f:/# netstat
Active Internet connections (w/o servers)
Proto Recv-Q Send-Q Local Address     Foreign Address   State
Active UNIX domain sockets (w/o servers)
Proto RefCnt Flags     Type     State       I-Node Path
This is running on a docker container with no active connections. It does, however, have services listening:
root@efcc0d32f10f:/# netstat -a
Active Internet connections (servers and established)
Proto Recv-Q Send-Q Local Address     Foreign Address   State
tcp        0      0 localhost:mysql   *:*               LISTEN
tcp        0      0 *:http            *:*               LISTEN
Active UNIX domain sockets (servers and established)
Proto RefCnt Flags     Type     State       I-Node Path
unix  2      [ ACC ]   STREAM   LISTENING   53476  /var/run/mysqld/mysqld.sock
The -a flag tells netstat to list all sockets, whether there are
active connections or not. We can see that there are two network
sockets running, and one Unix (non-network) socket. The first network
socket is listening for connections from localhost only, on the
standard TCP port used by MySql. The second network socket is listening
for HTTP connections from anywhere over TCP.
If we look in /etc/services, we can find out what these ports are:
root@efcc0d32f10f:/# grep mysql /etc/services
mysql           3306/tcp
mysql           3306/udp
mysql-proxy     6446/tcp                        # MySQL Proxy
mysql-proxy     6446/udp
root@efcc0d32f10f:/# grep http /etc/services
# Updated from http://www.iana.org/assignments/port-numbers and other
# sources like http://www.freebsd.org/cgi/cvsweb.cgi/src/etc/services .
http            80/tcp          www             # WorldWideWeb HTTP
http            80/udp                          # HyperText Transfer Protocol
https           443/tcp                         # http protocol over TLS/SSL
https           443/udp
http-alt        8080/tcp        webcache        # WWW caching service
http-alt        8080/udp
We can identify the relevant lines (exact service match, and TCP) as
mysql           3306/tcp
http            80/tcp          www             # WorldWideWeb HTTP
This is a bit cumbersome, so we will add the -n flag, to leave numbers
as numbers, and not look them up:
root@efcc0d32f10f:/# netstat -an
Active Internet connections (servers and established)
Proto Recv-Q Send-Q Local Address     Foreign Address   State
tcp        0      0 127.0.0.1:3306    0.0.0.0:*         LISTEN
tcp        0      0 0.0.0.0:80        0.0.0.0:*         LISTEN
Active UNIX domain sockets (servers and established)
Proto RefCnt Flags     Type     State       I-Node Path
unix  2      [ ACC ]   STREAM   LISTENING   53476  /var/run/mysqld/mysqld.sock
Here we see not only that the ports are given numerically, but so are
localhost (127.0.0.1) and * (0.0.0.0). This will also tend to
be faster, especially once we are dealing with remote connections,
where we would have to perform a reverse DNS lookup to map IP
addresses to host names.
We can also limit ourselves to TCP sockets:
root@efcc0d32f10f:/# netstat -ant
Active Internet connections (servers and established)
Proto Recv-Q Send-Q Local Address     Foreign Address   State
tcp        0      0 127.0.0.1:3306    0.0.0.0:*         LISTEN
tcp        0      0 0.0.0.0:80        0.0.0.0:*         LISTEN
UDP sockets:
root@efcc0d32f10f:/# netstat -anu
Active Internet connections (servers and established)
Proto Recv-Q Send-Q Local Address     Foreign Address   State
or both:
root@efcc0d32f10f:/# netstat -antu
Active Internet connections (servers and established)
Proto Recv-Q Send-Q Local Address     Foreign Address   State
tcp        0      0 127.0.0.1:3306    0.0.0.0:*         LISTEN
tcp        0      0 0.0.0.0:80        0.0.0.0:*         LISTEN
We can also request the process name and ID for the sockets:
root@efcc0d32f10f:/# netstat -antup
Active Internet connections (servers and established)
Proto Recv-Q Send-Q Local Address     Foreign Address   State   PID/Program name
tcp        0      0 127.0.0.1:3306    0.0.0.0:*         LISTEN  -
tcp        0      0 0.0.0.0:80        0.0.0.0:*         LISTEN  479/apache2
We do not always get this information, though.
An important thing to note is that we can list the arguments separately or combined, and the order does not matter:
root@efcc0d32f10f:/# netstat -a -n -t -u
Active Internet connections (servers and established)
Proto Recv-Q Send-Q Local Address     Foreign Address   State
tcp        0      0 127.0.0.1:3306    0.0.0.0:*         LISTEN
tcp        0      0 0.0.0.0:80        0.0.0.0:*         LISTEN

root@efcc0d32f10f:/# netstat -aunt
Active Internet connections (servers and established)
Proto Recv-Q Send-Q Local Address     Foreign Address   State
tcp        0      0 127.0.0.1:3306    0.0.0.0:*         LISTEN
tcp        0      0 0.0.0.0:80        0.0.0.0:*         LISTEN

root@efcc0d32f10f:/# netstat -tuna
Active Internet connections (servers and established)
Proto Recv-Q Send-Q Local Address     Foreign Address   State
tcp        0      0 127.0.0.1:3306    0.0.0.0:*         LISTEN
tcp        0      0 0.0.0.0:80        0.0.0.0:*         LISTEN

root@efcc0d32f10f:/# netstat -taun
Active Internet connections (servers and established)
Proto Recv-Q Send-Q Local Address     Foreign Address   State
tcp        0      0 127.0.0.1:3306    0.0.0.0:*         LISTEN
tcp        0      0 0.0.0.0:80        0.0.0.0:*         LISTEN
It is also worth noting that some versions of netstat behave
slightly differently. On MacOS, for example, the -u flag specifies
Unix sockets, not UDP.
We can also see what an active connection looks like:
root@efcc0d32f10f:/# nc localhost 80
root@efcc0d32f10f:/# netstat -taun
Active Internet connections (servers and established)
Proto Recv-Q Send-Q Local Address     Foreign Address   State
tcp        0      0 127.0.0.1:3306    0.0.0.0:*         LISTEN
tcp        0      0 0.0.0.0:80        0.0.0.0:*         LISTEN
tcp        0      0 127.0.0.1:80      127.0.0.1:35226   SYN_RECV
tcp        0      0 127.0.0.1:35226   127.0.0.1:80      ESTABLISHED
The first command is run in a separate shell. We can see that there
are two new sockets, one on port 80 that has received a connection
from port 35226 and another on port 35226 that has established a
connection to port 80. A normal interaction via a web browser would
have both of these sockets in the ESTABLISHED state, which is part
of the TCP protocol.
| Argument | Meaning |
-a |
Show all sockets |
-t |
Show TCP sockets |
-u |
Show UDP sockets |
-n |
Show numbers, not names |
-p |
Show PID and process name |
3.5 Local Networking
Local networking is handled primarily by layer 2, the datalink layer. Linux interacts with layer 2 through devices. These might be Ethernet cards, WiFi radios, cellular radios, or even internal virtual devices. In practice, we need to know very little about the layer 2 specifics, since the Linux kernel abstracts this for us. Since applications more directly work with layer 3, we will also see how this interacts with layer 2 at the local level.
3.5.1 Examining Devices with ifconfig (The Old Way)
We can examine all of the existing devices on our system with the
command ifconfig. By default, it will only show the active
devices. The -a option will list all devices. Here is an example, from the
cmsc389z docker image:
crow@d1b9b82f7557:/$ ifconfig
eth0: flags=4163<UP,BROADCAST,RUNNING,MULTICAST>  mtu 1500
        inet 172.17.0.2  netmask 255.255.0.0  broadcast 172.17.255.255
        ether 02:42:ac:11:00:02  txqueuelen 0  (Ethernet)
        RX packets 15  bytes 1226 (1.2 KB)
        RX errors 0  dropped 0  overruns 0  frame 0
        TX packets 0  bytes 0 (0.0 B)
        TX errors 0  dropped 0 overruns 0  carrier 0  collisions 0

lo: flags=73<UP,LOOPBACK,RUNNING>  mtu 65536
        inet 127.0.0.1  netmask 255.0.0.0
        loop  txqueuelen 1000  (Local Loopback)
        RX packets 0  bytes 0 (0.0 B)
        RX errors 0  dropped 0  overruns 0  frame 0
        TX packets 0  bytes 0 (0.0 B)
        TX errors 0  dropped 0 overruns 0  carrier 0  collisions 0

crow@d1b9b82f7557:/$
crow@d1b9b82f7557:/$ ifconfig -a
eth0: flags=4163<UP,BROADCAST,RUNNING,MULTICAST>  mtu 1500
        inet 172.17.0.2  netmask 255.255.0.0  broadcast 172.17.255.255
        ether 02:42:ac:11:00:02  txqueuelen 0  (Ethernet)
        RX packets 15  bytes 1226 (1.2 KB)
        RX errors 0  dropped 0  overruns 0  frame 0
        TX packets 0  bytes 0 (0.0 B)
        TX errors 0  dropped 0 overruns 0  carrier 0  collisions 0

ip6tnl0: flags=128<NOARP>  mtu 1452
        unspec 00-00-00-00-00-00-00-00-00-00-00-00-00-00-00-00  txqueuelen 1000  (UNSPEC)
        RX packets 0  bytes 0 (0.0 B)
        RX errors 0  dropped 0  overruns 0  frame 0
        TX packets 0  bytes 0 (0.0 B)
        TX errors 0  dropped 0 overruns 0  carrier 0  collisions 0

lo: flags=73<UP,LOOPBACK,RUNNING>  mtu 65536
        inet 127.0.0.1  netmask 255.0.0.0
        loop  txqueuelen 1000  (Local Loopback)
        RX packets 0  bytes 0 (0.0 B)
        RX errors 0  dropped 0  overruns 0  frame 0
        TX packets 0  bytes 0 (0.0 B)
        TX errors 0  dropped 0 overruns 0  carrier 0  collisions 0

tunl0: flags=128<NOARP>  mtu 1480
        tunnel   txqueuelen 1000  (IPIP Tunnel)
        RX packets 0  bytes 0 (0.0 B)
        RX errors 0  dropped 0  overruns 0  frame 0
        TX packets 0  bytes 0 (0.0 B)
        TX errors 0  dropped 0 overruns 0  carrier 0  collisions 0
Consider the following lines for eth0 (Ethernet device 0):
eth0: flags=4163<UP,BROADCAST,RUNNING,MULTICAST>  mtu 1500
        inet 172.17.0.2  netmask 255.255.0.0  broadcast 172.17.255.255
        ether 02:42:ac:11:00:02  txqueuelen 0  (Ethernet)
The first line tells us that the device is “up” and “running”, meaning it is ready to send and receive traffic. It also tells us that the device supports both broadcast (send a message to every host on the local network) and multicast (send a message to a specific set of hosts, possibly on other networks). Further, it tells us that this device supports data frames up to 1500 bytes (the Maximum Transmission Unit, or MTU).
The second line tells us the internet address for this device — each device will have its own address. It also specifies a netmask, which we can use to identify IP addresses on this same local network by performing a bitwise-AND of the address and netmask. If these values are equal, then they are on the same subnet. The broadcast address is the highest address in the subnet, and messages sent to this address will be delivered to the entire subnet.
The third line tells us the layer 2 (ether) address for the device. This is often called the MAC (Media Access Control) address. While
IP addresses are written in dotted-quad format, MAC addresses are
written in colon-separated hexadecimal, where the colons separate
individual bytes.
3.5.2 Examining Devices with iproute2 (The New Way)
While ifconfig is a useful command to know, and still commonly
referenced, we are not going to use it further. There is a newer
networking package called iproute2, that was introduced in 2006, and
this is what we will use. The primary command in this package is
ip, which has a number of subcommands. We will begin with the ip
link subcommand, which is analogous to ifconfig:
crow@d1b9b82f7557:/$ ip link
1: lo: <LOOPBACK,UP,LOWER_UP> mtu 65536 qdisc noqueue state UNKNOWN mode DEFAULT group default qlen 1000
link/loopback 00:00:00:00:00:00 brd 00:00:00:00:00:00
2: tunl0@NONE: <NOARP> mtu 1480 qdisc noop state DOWN mode DEFAULT group default qlen 1000
link/ipip 0.0.0.0 brd 0.0.0.0
3: ip6tnl0@NONE: <NOARP> mtu 1452 qdisc noop state DOWN mode DEFAULT group default qlen 1000
link/tunnel6 :: brd ::
496: eth0@if497: <BROADCAST,MULTICAST,UP,LOWER_UP> mtu 1500 qdisc noqueue state UP mode DEFAULT group default
link/ether 02:42:ac:11:00:02 brd ff:ff:ff:ff:ff:ff link-netnsid 0
We can look at a specific device with ip link show:
crow@d1b9b82f7557:/$ ip link show eth0
496: eth0@if497: <BROADCAST,MULTICAST,UP,LOWER_UP> mtu 1500 qdisc noqueue state UP mode DEFAULT group default
link/ether 02:42:ac:11:00:02 brd ff:ff:ff:ff:ff:ff link-netnsid 0
We can see most of the information that ifconfig eth0 would show us,
with additional information. Some of this will make more sense soon.
What we do not see is the layer 3 information. We can view this with
ip address show:
crow@d1b9b82f7557:/$ ip address show eth0
496: eth0@if497: <BROADCAST,MULTICAST,UP,LOWER_UP> mtu 1500 qdisc noqueue state UP group default
link/ether 02:42:ac:11:00:02 brd ff:ff:ff:ff:ff:ff link-netnsid 0
inet 172.17.0.2/16 brd 172.17.255.255 scope global eth0
valid_lft forever preferred_lft forever
Now we see the rest of the information we looked at for ifconfig, but
instead of a netmask, we get the IP address in CIDR notation.
We can see additional layer 3 information for our local network with
the ip route subcommand:
crow@475283dd6ec2:/$ ip route
default via 172.17.0.1 dev eth0
172.17.0.0/16 dev eth0 proto kernel scope link src 172.17.0.2
This tells us that the default route, for anything not specified by an
explicit route, is using the gateway router with address 172.17.0.1,
and which is reachable via the eth0 device. Further, it tells us
that any destination in the 172.17.0.0/16 CIDR block is reached via
the eth0 device, and our source address for this is
172.17.0.2. Note that this is the same address that appears in ip
address show eth0.
3.5.3 Creating Virtual Devices
At the beginning of this chapter, we mentioned virtual devices at
layer 2. The most common virtual device is loopback, and you might
have noticed this in the output of ifconfig and ip link. The
device name is usually lo or lo0. This is a virtual device for
delivering layer 3 traffic between processes on the same host, which
has the special name localhost. It has a much simpler frame
structure than Ethernet, and is extremely fast (high bandwidth, low
latency).
There are other virtual devices often found on a host. Tunnels provide virtual devices that encapsulate data from one protocol in another, either to translate between protocols (like forwarding IPv6 packets through an IPv4 network) or to make traffic appear to flow through a different local network (such as a Virtual Private Network). Virtual devices are also used to move data between a virtual machine or container’s network and the host’s network.
We can create our own virtual devices using the ip link command by adding
a new link of type veth (virtual ethernet). This must be done as the
root user, as must most of the rest of the commands in this section. root@eaa156967336:/# ip link add v0 type veth peer name v1
root@eaa156967336:/# ip link show
1: lo: <LOOPBACK,UP,LOWER_UP> mtu 65536 qdisc noqueue state UNKNOWN mode DEFAULT group default qlen 1000
link/loopback 00:00:00:00:00:00 brd 00:00:00:00:00:00
2: tunl0@NONE: <NOARP> mtu 1480 qdisc noop state DOWN mode DEFAULT group default qlen 1000
link/ipip 0.0.0.0 brd 0.0.0.0
3: ip6tnl0@NONE: <NOARP> mtu 1452 qdisc noop state DOWN mode DEFAULT group default qlen 1000
link/tunnel6 :: brd ::
6: v1@v0: <BROADCAST,MULTICAST,M-DOWN> mtu 1500 qdisc noop state DOWN mode DEFAULT group default qlen 1000
link/ether 66:59:d5:2d:62:7b brd ff:ff:ff:ff:ff:ff
7: v0@v1: <BROADCAST,MULTICAST,M-DOWN> mtu 1500 qdisc noop state DOWN mode DEFAULT group default qlen 1000
link/ether 16:b6:e1:98:ed:b9 brd ff:ff:ff:ff:ff:ff
16: eth0@if17: <BROADCAST,MULTICAST,UP,LOWER_UP> mtu 1500 qdisc noqueue state UP mode DEFAULT group default
link/ether 02:42:ac:11:00:02 brd ff:ff:ff:ff:ff:ff link-netnsid 0
The ip link add command adds a new device, in this case named v0. We specify veth as the type, which then requires us to define a peer
device locally, which we name v1 with the peer name argument. Note
that we now have two devices, which are shown as v0@v1 and v1@v0. The
actual device name is given before the @, and the peer device is given
after the @:
root@eaa156967336:/# ip link show v0
7: v0@v1: <BROADCAST,MULTICAST,M-DOWN> mtu 1500 qdisc noop state DOWN mode DEFAULT group default qlen 1000
link/ether 16:b6:e1:98:ed:b9 brd ff:ff:ff:ff:ff:ff
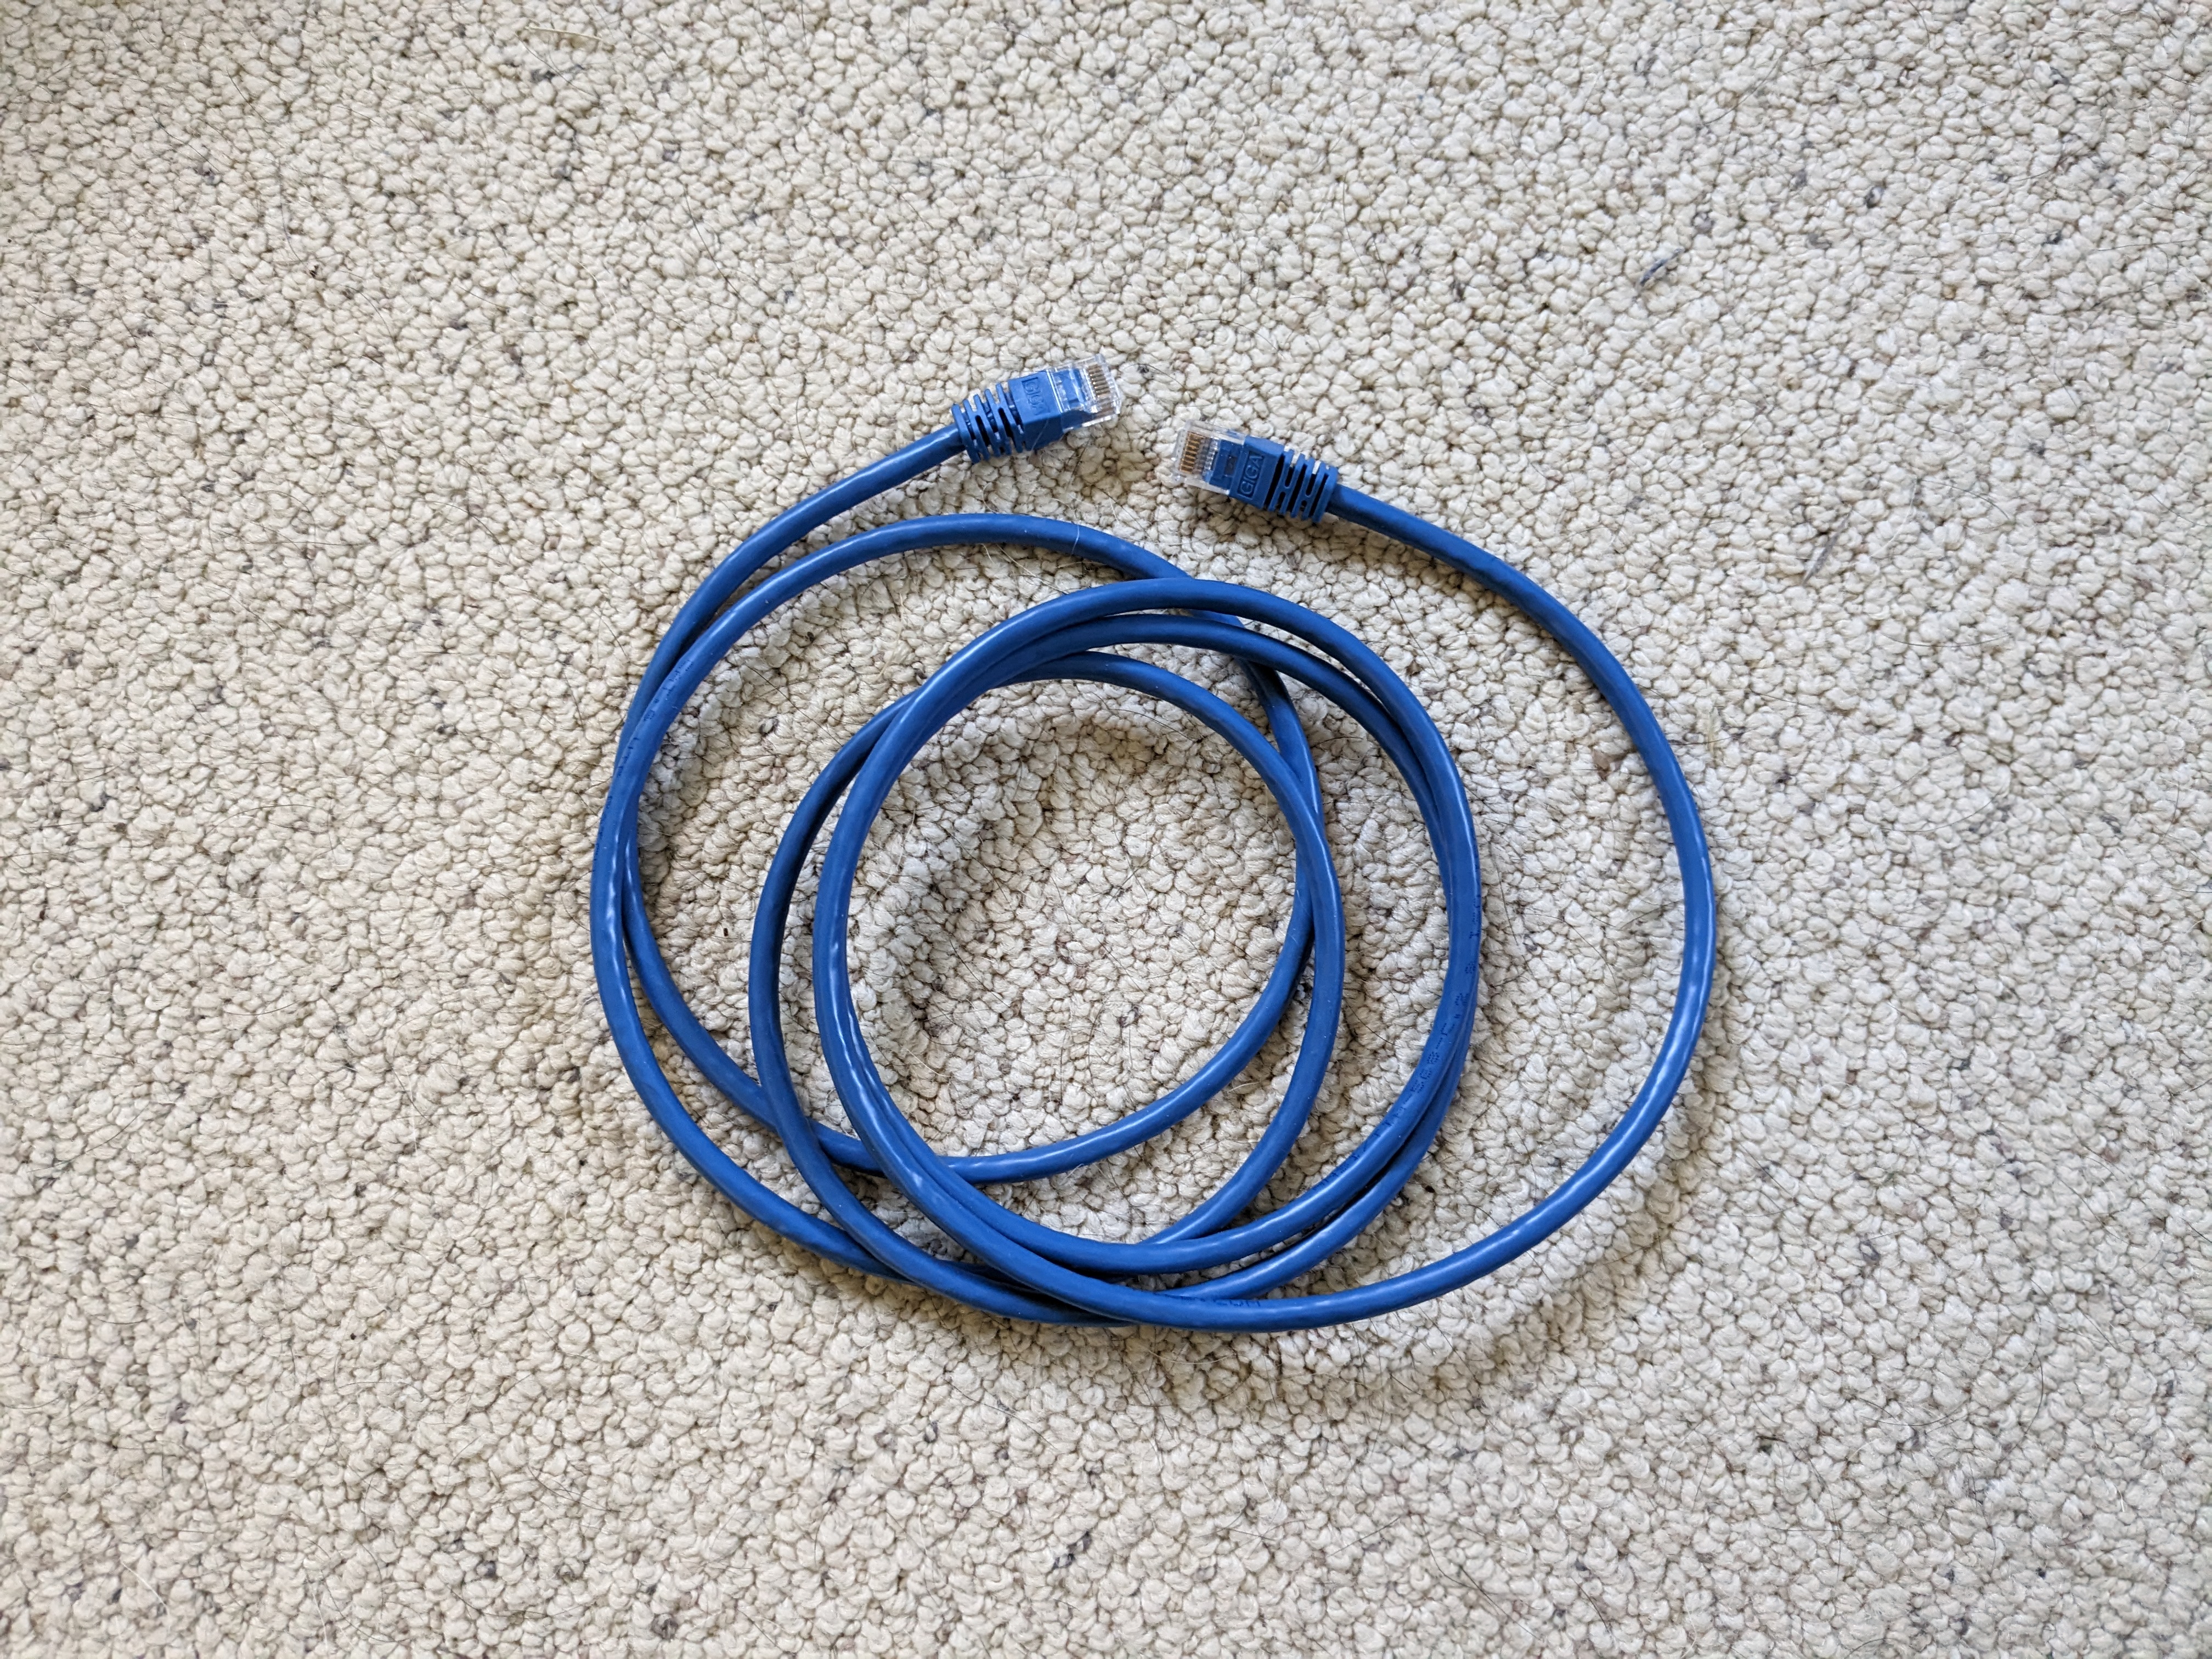
What have we actually done here? We have essentially created a virtual ethernet cable (Figure 3.1). Technically, we have actually created a cable with a virtual NIC on either end, but this cable analogy will help us understand the structure we are building.
These devices are, by default, created in the down state. That is, they
are not ready to send or receive data. In order to do this, we must first
add IP addresses to the devices:
root@eaa156967336:/# ip addr show v0
7: v0@v1: <BROADCAST,MULTICAST,M-DOWN> mtu 1500 qdisc noop state DOWN group default qlen 1000
link/ether 16:b6:e1:98:ed:b9 brd ff:ff:ff:ff:ff:ff
root@eaa156967336:/#
root@eaa156967336:/# ip addr add 1.2.3.4/32 dev v0
root@eaa156967336:/# ip addr show v0
7: v0@v1: <BROADCAST,MULTICAST,M-DOWN> mtu 1500 qdisc noop state DOWN group default qlen 1000
link/ether 16:b6:e1:98:ed:b9 brd ff:ff:ff:ff:ff:ff
inet 1.2.3.4/32 scope global v0
valid_lft forever preferred_lft forever
We see that initially there is no address set for device v0. We then
run ip addr add, after which the address has been set. Note that we
have to specify the address as a /32 CIDR block, and the device is
given as the last option. Now we can bring the link up:
root@eaa156967336:/# ip link set v0 up
root@eaa156967336:/# ip link show v0
7: v0@v1: <NO-CARRIER,BROADCAST,MULTICAST,UP,M-DOWN> mtu 1500 qdisc noqueue state LOWERLAYERDOWN mode DEFAULT group default qlen 1000
link/ether 16:b6:e1:98:ed:b9 brd ff:ff:ff:ff:ff:ff
We cannot send data through this device until the other end of the link, the
peer v1, has also been configured and brought up:
root@eaa156967336:/# ip addr add 1.2.3.5/32 dev v1
root@eaa156967336:/# ip link set v1 up
root@eaa156967336:/# ip addr show v1
6: v1@v0: <BROADCAST,MULTICAST,UP,LOWER_UP> mtu 1500 qdisc noqueue state UP group default qlen 1000
link/ether 66:59:d5:2d:62:7b brd ff:ff:ff:ff:ff:ff
inet 1.2.3.5/32 scope global v1
valid_lft forever preferred_lft forever
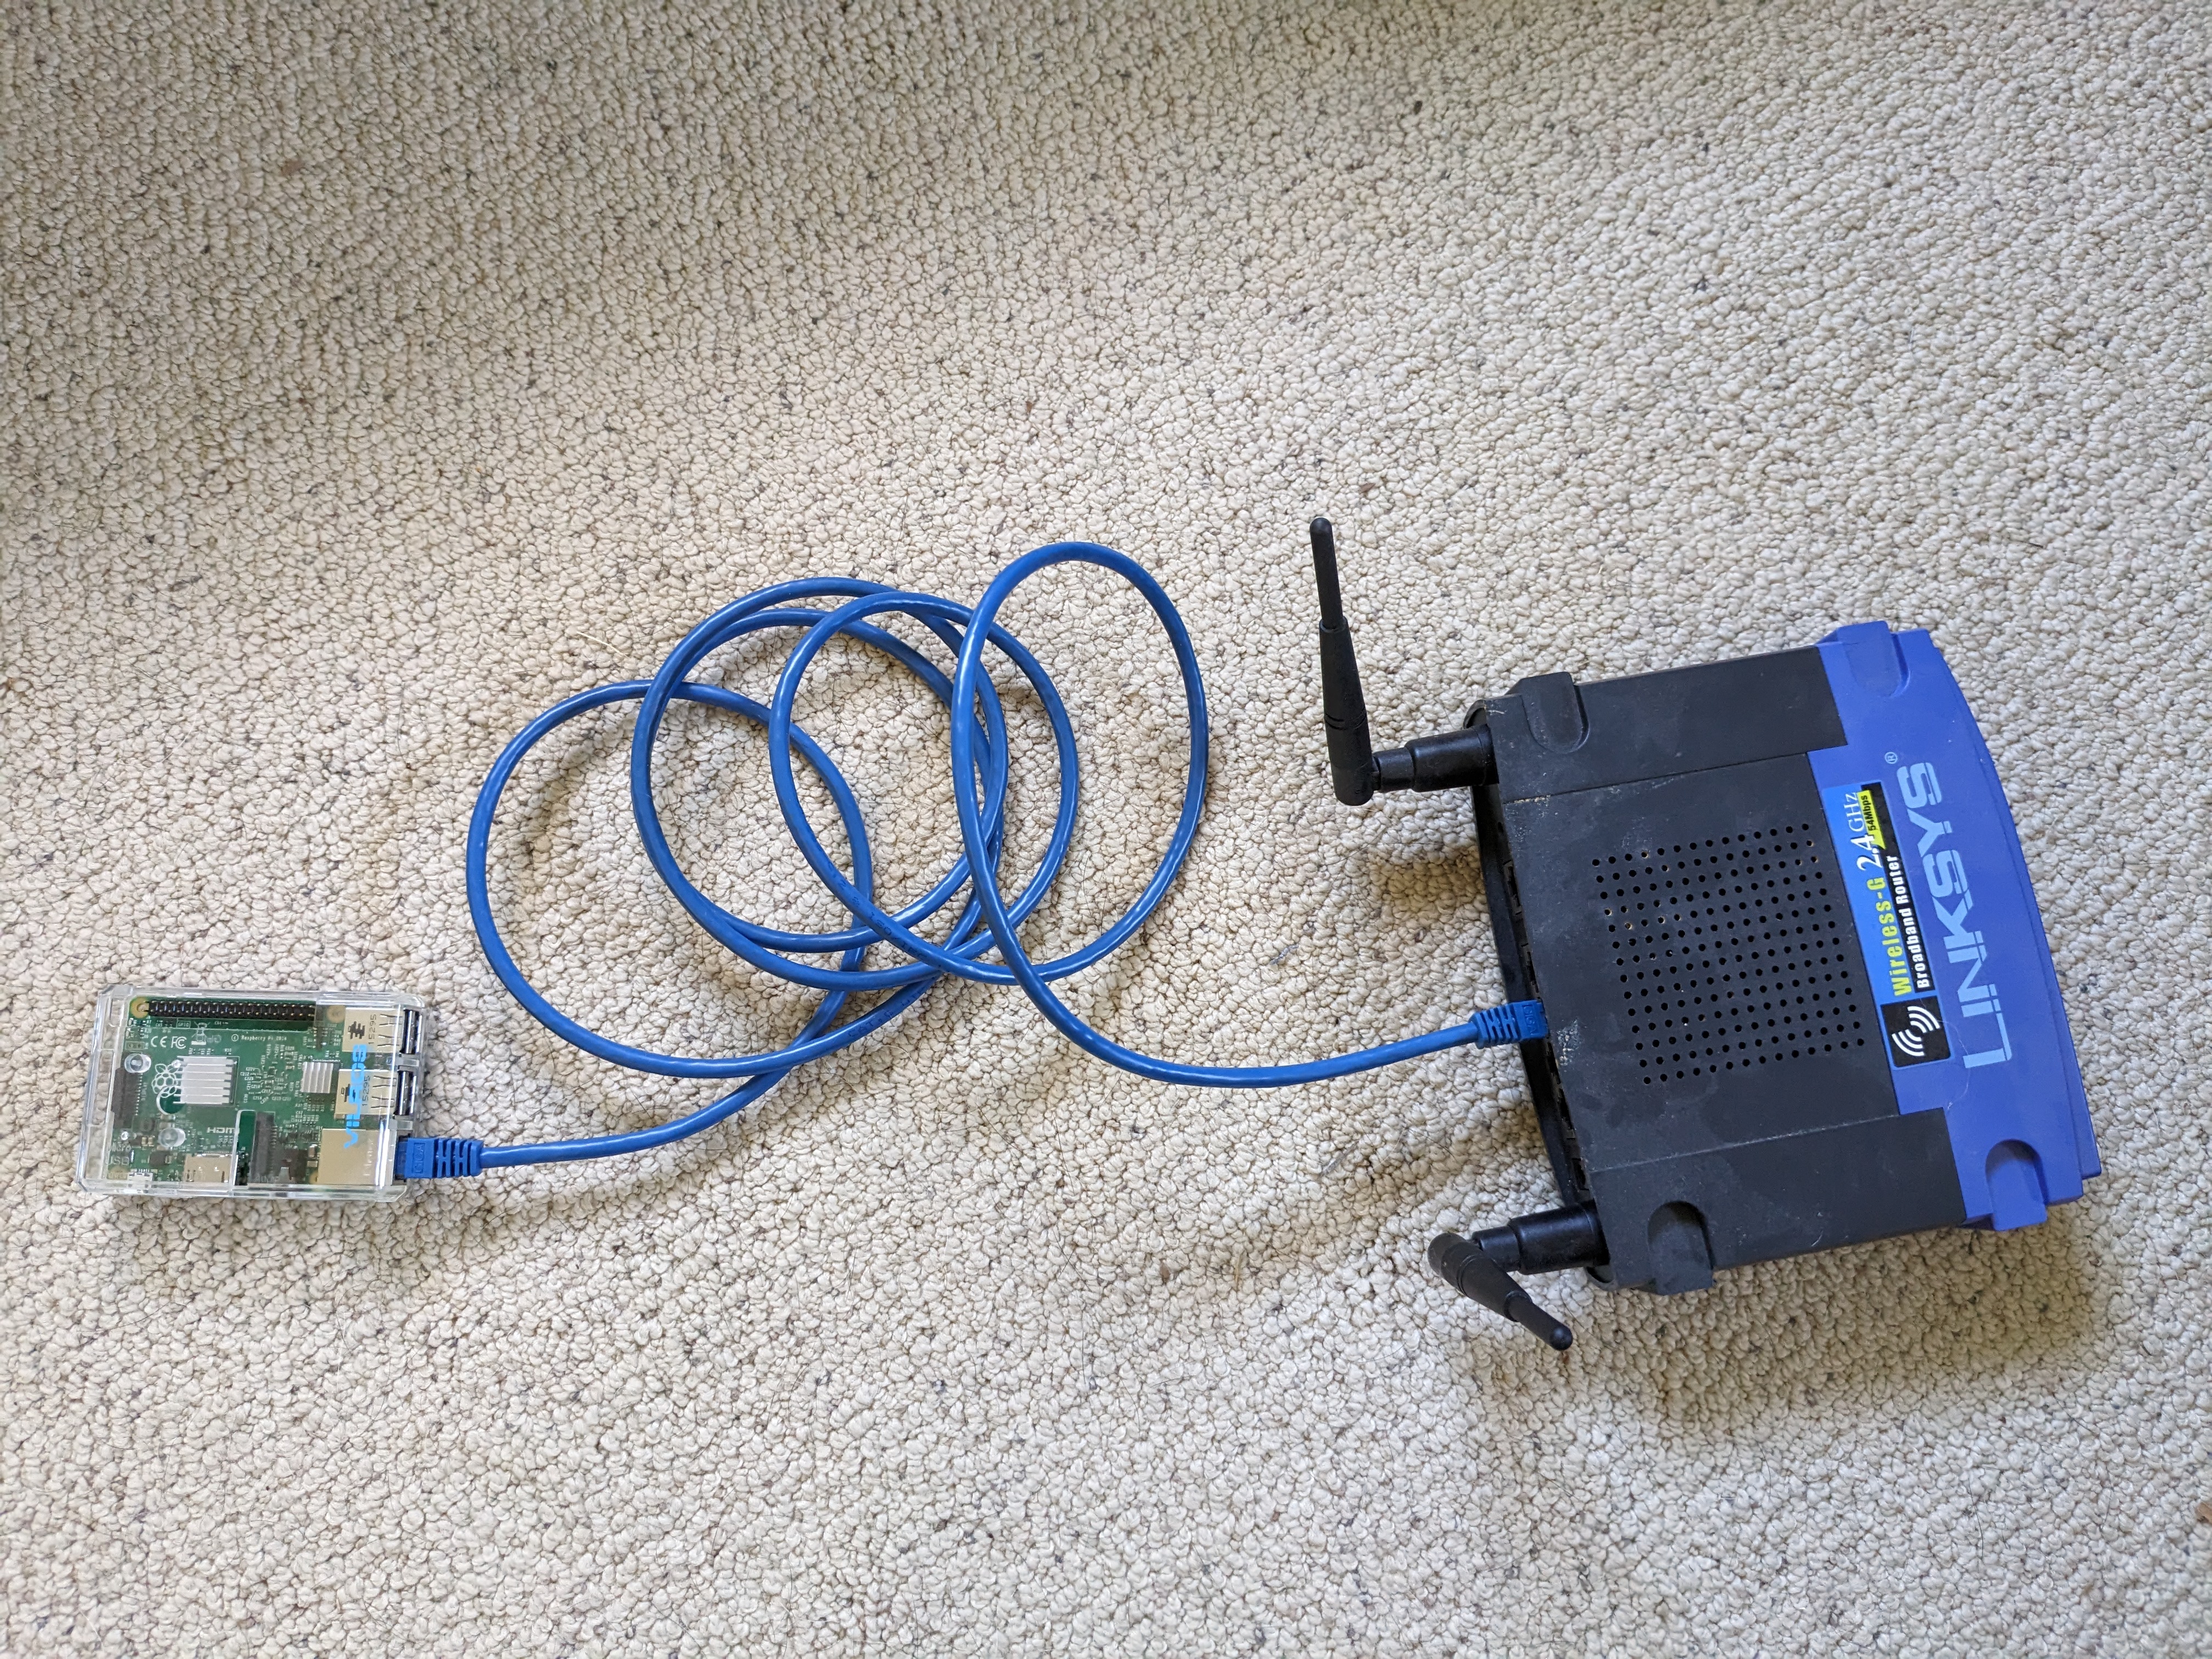
At this point, we essentially have connected the two devices as shown in Figure 3.2. We will see how to add forwarding routes to these devices and make them behave like physical links in Section 3.7.
3.6 End-to-End Connections
We have already seen how we can use netcat to send data across a connection, and this is certainly one way verify that a network connection is active. That requires a specific application to run at each end, however, so it is more a test of a data protocol than connectivity.
If what we want to test is whether it is possible to send any data between two hosts, we want something lower-level that is (almost) always present. Fortunately, there is a protocol that can help us with this, called the Internet Control Message Protocol, or ICMP.
ICMP has a number of uses. Mostly, it is used by the network to signal problems, such as a subnet or host being unreachable. All hosts implementing IP must also implement at least some of the ICMP protocol. It also has a pair of messages called Echo Request and Echo Response. We collectively refer to these as ping.
We can use the command ping to send a series of ICMP Echo Requests
to a remote host, and wait for the corresponding responses. ping
sends a packet every second, and records the round-trip-time (RTT)
which is the sum of the one-way latencies. It also keeps track of how
many requests do not receive responses, providing a measure of the
packet loss on the connection.
root@eaa156967336:/# ping 8.8.8.8
PING 8.8.8.8 (8.8.8.8) 56(84) bytes of data.
64 bytes from 8.8.8.8: icmp_seq=1 ttl=37 time=18.8 ms
64 bytes from 8.8.8.8: icmp_seq=2 ttl=37 time=21.5 ms
64 bytes from 8.8.8.8: icmp_seq=3 ttl=37 time=11.5 ms
64 bytes from 8.8.8.8: icmp_seq=4 ttl=37 time=13.4 ms
64 bytes from 8.8.8.8: icmp_seq=5 ttl=37 time=13.8 ms
64 bytes from 8.8.8.8: icmp_seq=6 ttl=37 time=16.1 ms
64 bytes from 8.8.8.8: icmp_seq=7 ttl=37 time=19.9 ms
64 bytes from 8.8.8.8: icmp_seq=8 ttl=37 time=20.6 ms
64 bytes from 8.8.8.8: icmp_seq=9 ttl=37 time=13.0 ms
64 bytes from 8.8.8.8: icmp_seq=10 ttl=37 time=16.2 ms
64 bytes from 8.8.8.8: icmp_seq=11 ttl=37 time=18.4 ms
64 bytes from 8.8.8.8: icmp_seq=12 ttl=37 time=19.3 ms
--- 8.8.8.8 ping statistics ---
12 packets transmitted, 12 received, 0% packet loss, time 11037ms
rtt min/avg/max/mdev = 11.514/16.865/21.451/3.187 ms
Since the RTT varies from packet to packet, ping presents some
statistics at the end. Roughly 60% of packets are expected to have
RTTs within one standard deviation (mdev) of the average (avg). We can also limit the number of ping requests with the -c option. See the documentation for more details.
Not all hosts will respond to ping requests, so sometimes we will see 100% packet loss:
root@eaa156967336:/# ping 2.3.4.5
PING 2.3.4.5 (2.3.4.5) 56(84) bytes of data.
--- 2.3.4.5 ping statistics ---
7 packets transmitted, 0 received, 100% packet loss, time 6162ms
In this case, we do not know whether there is no host with address
2.3.4.5, whether it is not responding to pings, or if there is a
problem with the connection.
We have another tool that can shed some light on this, called
traceroute. This takes advantage of a field in the IP header called
Time-to-Live, or TTL. Each router that receives a packet decrements
the value of this field, and if it reaches 0 the packet is
discarded. The main purpose of this is to prevent packets from
propagating indefinitely in the event of a routing loop. This occurs
when a router A forwards a packet to destination d, and some
router B further along the forwarding path sends it back to
A. When the TTL reaches 0, the router discarding the packet sends an
ICMP TTL Exceeded message back to the source.
How does traceroute use the TTL? It begins by sending a packet to
the destination with a TTL of 1. This causes the first router to send
a TTL Exceeded message back, which includes the router’s IP address as
the source. It then increases the initial TTL by 1, in order to learn
the IP address of the second router. This continues until either the
destination responds or a certain number of failures are observed. root@eaa156967336:/# traceroute 8.8.8.8
traceroute to 8.8.8.8 (8.8.8.8), 30 hops max, 60 byte packets
1 172.17.0.1 (172.17.0.1) 2.479 ms 0.016 ms 0.006 ms
2 Fios_Quantum_Gateway.fios-router.home (192.168.1.1) 4.587 ms 4.861 ms 5.249 ms
3 lo0-100.WASHDC-VFTTP-368.verizon-gni.net (72.83.250.1) 15.181 ms 14.913 ms 14.952 ms
4 100.41.32.46 (100.41.32.46) 21.881 ms 21.711 ms 23.656 ms
5 0.ae1.GW16.IAD8.ALTER.NET (140.222.3.87) 24.254 ms 0.ae2.GW16.IAD8.ALTER.NET (140.222.3.89) 15.191 ms 0.ae1.GW16.IAD8.ALTER.NET (140.222.3.87) 24.418 ms
6 204.148.170.158 (204.148.170.158) 23.847 ms 9.642 ms 9.502 ms
7 * * *
8 142.251.70.110 (142.251.70.110) 12.857 ms dns.google (8.8.8.8) 11.014 ms 10.285 ms
What we see on each line is the TTL, the IP address (and possibly
hostname) of the router at that distance, and then three round-trip
times. Why three? Because traceroute actually repeats each distance
probe three times, to show the statistical variation. We also
sometimes see multiple router addresses on a line. That is because
there are often multiple paths from a source to a destination, so we
do not always see the same routers along the way. This also means that
just because two routers appear on adjacent lines in the traceroute
output, that does not mean they are directly connected.
Let’s see our failed ping:
root@eaa156967336:/# traceroute 2.3.4.5
traceroute to 2.3.4.5 (2.3.4.5), 30 hops max, 60 byte packets
1 172.17.0.1 (172.17.0.1) 0.073 ms 0.013 ms 0.009 ms
2 Fios_Quantum_Gateway.fios-router.home (192.168.1.1) 9.976 ms 10.308 ms 10.273 ms
3 lo0-100.WASHDC-VFTTP-368.verizon-gni.net (72.83.250.1) 22.969 ms 23.104 ms 23.118 ms
4 100.41.32.44 (100.41.32.44) 23.456 ms 100.41.32.46 (100.41.32.46) 23.730 ms 23.492 ms
5 0.ae1.GW12.IAD8.ALTER.NET (140.222.234.27) 24.603 ms 0.ae2.GW12.IAD8.ALTER.NET (140.222.234.29) 23.815 ms 0.ae1.GW12.IAD8.ALTER.NET (140.222.234.27) 24.313 ms
6 63.88.105.94 (63.88.105.94) 23.912 ms 11.488 ms *
7 81.52.166.172 (81.52.166.172) 113.875 ms 108.002 ms *
8 ae324-0.ffttr7.frankfurt.opentransit.net (193.251.240.102) 103.174 ms 104.060 ms 103.430 ms
9 * * *
10 * * *
29 * * *
30 * * *
Each * represents a packet sent for which no response was
received. The lines with * * * received no responses from those TTL
values. We have omitted most of these. From this, we can see that the
last router to receive our packet was 193.251.240.102. So, what does
this tell us? That depends on what we know about the destination and
the router. We will revisit this in Chapter 4.
There is an important consideration when looking at these IP
addresses. We noted in Section 3.5 that every device
on a host has its own IP address. A router has many network devices,
and the IP address we see is for the device that received the packet
and decremented the TTL to 0. That is, what we are learning are the
“near-end” IP addresses of the router. It is entirely possible that
the router at 193.251.240.102 has another device in, say,
2.3.0.0/16.
3.7 Network Namespaces
We have looked at the network stack (there is still a lot left to explore), and seen how each host on the network has its own stack. Linux also allows us to have multiple independent network stacks on the same host. It does this using network namespaces. Much like namespaces in programming languages, network namespaces make their devices (objects) visible only to other processes (methods) and devices within the same namespace.
The ip netns subcommand manages network namespaces in Linux. You can
view the existing namespaces:
root@eaa156967336:/# ip netns
root@eaa156967336:/# ip netns show
root@eaa156967336:/#
These commands are equivalent, and you can see that, by default, there are no namespaces defined.
We can add a namespace with ip netns add:
root@eaa156967336:/# ip netns add foo
root@eaa156967336:/# ip netns
foo
We can also delete them with ip netns del:
root@eaa156967336:/# ip netns del foo
root@eaa156967336:/# ip netns
root@eaa156967336:/#
Any program can be run in a namespace using ip netns exec:
root@eaa156967336:/# ip netns add foo
root@eaa156967336:/# ls
bin dev home lib32 libx32 mnt proc run srv tmp var
boot etc lib lib64 media opt root sbin sys usr
root@eaa156967336:/# ip netns exec foo ls
bin dev home lib32 libx32 mnt proc run srv tmp var
boot etc lib lib64 media opt root sbin sys usr
What does this show us? It shows that we are in the same filesystem,
with access to all of the files and programs. Let’s look at something
that differs:
root@eaa156967336:/# ip link
1: lo: <LOOPBACK,UP,LOWER_UP> mtu 65536 qdisc noqueue state UNKNOWN mode DEFAULT group default qlen 1000
link/loopback 00:00:00:00:00:00 brd 00:00:00:00:00:00
2: tunl0@NONE: <NOARP> mtu 1480 qdisc noop state DOWN mode DEFAULT group default qlen 1000
link/ipip 0.0.0.0 brd 0.0.0.0
3: ip6tnl0@NONE: <NOARP> mtu 1452 qdisc noop state DOWN mode DEFAULT group default qlen 1000
link/tunnel6 :: brd ::
6: v1@v0: <BROADCAST,MULTICAST,UP,LOWER_UP> mtu 1500 qdisc noqueue state UP mode DEFAULT group default qlen 1000
link/ether 66:59:d5:2d:62:7b brd ff:ff:ff:ff:ff:ff
7: v0@v1: <BROADCAST,MULTICAST,UP,LOWER_UP> mtu 1500 qdisc noqueue state UP mode DEFAULT group default qlen 1000
link/ether 16:b6:e1:98:ed:b9 brd ff:ff:ff:ff:ff:ff
16: eth0@if17: <BROADCAST,MULTICAST,UP,LOWER_UP> mtu 1500 qdisc noqueue state UP mode DEFAULT group default
link/ether 02:42:ac:11:00:02 brd ff:ff:ff:ff:ff:ff link-netnsid 0
root@eaa156967336:/#
root@eaa156967336:/# ip netns exec foo ip link
1: lo: <LOOPBACK> mtu 65536 qdisc noop state DOWN mode DEFAULT group default qlen 1000
link/loopback 00:00:00:00:00:00 brd 00:00:00:00:00:00
2: tunl0@NONE: <NOARP> mtu 1480 qdisc noop state DOWN mode DEFAULT group default qlen 1000
link/ipip 0.0.0.0 brd 0.0.0.0
3: ip6tnl0@NONE: <NOARP> mtu 1452 qdisc noop state DOWN mode DEFAULT group default qlen 1000
link/tunnel6 :: brd ::
If we are not in the namespace, we have all of our normal devices
(including the veth link we created before). In the namespace, we
have fewer, all of which are down.
We can run ping on the loopback address 127.0.0.1:
root@eaa156967336:/# ping -c 3 127.0.0.1
PING 127.0.0.1 (127.0.0.1) 56(84) bytes of data.
64 bytes from 127.0.0.1: icmp_seq=1 ttl=64 time=0.045 ms
64 bytes from 127.0.0.1: icmp_seq=2 ttl=64 time=0.091 ms
64 bytes from 127.0.0.1: icmp_seq=3 ttl=64 time=0.094 ms
--- 127.0.0.1 ping statistics ---
3 packets transmitted, 3 received, 0% packet loss, time 2060ms
rtt min/avg/max/mdev = 0.045/0.076/0.094/0.022 ms
root@eaa156967336:/# ip netns exec foo ping -c 3 127.0.0.1
ping: connect: Network is unreachable
Here we see that in the foo namespace, we are unable to ping ourselves,
because the lo device is down.
root@eaa156967336:/# ip netns exec foo ip link set lo up
root@eaa156967336:/# ip netns exec foo ping -c 3 127.0.0.1
PING 127.0.0.1 (127.0.0.1) 56(84) bytes of data.
64 bytes from 127.0.0.1: icmp_seq=1 ttl=64 time=0.050 ms
64 bytes from 127.0.0.1: icmp_seq=2 ttl=64 time=0.087 ms
64 bytes from 127.0.0.1: icmp_seq=3 ttl=64 time=0.109 ms
--- 127.0.0.1 ping statistics ---
3 packets transmitted, 3 received, 0% packet loss, time 2027ms
rtt min/avg/max/mdev = 0.050/0.082/0.109/0.024 ms
Now that lo is up, we can ping over loopback.
3.7.1 Using Namespaces to Create Virtual Hosts
We are going to see how to use network namespaces to create a testbed. This is an emulated network in a controlled environment, which can be an essential part of debugging and testing a network protocol. To do this, we are going to create a separate namespace for every virtual host in our testbed. We will then add links between them, configure routing, and even set link characteristics to control bandwidth, latency, and packet loss.
To start, we want a second namespace, which we will call bar:
root@eaa156967336:/# ip netns add bar
root@eaa156967336:/# ip netns
bar
foo
We will need to bring the lo device up in namespace bar before we
can send any packets. Recall that we have two virtual devices, v0
and v1, connected as a virtual ethernet link. root@eaa156967336:/# ip link show type veth
6: v1@v0: <BROADCAST,MULTICAST,UP,LOWER_UP> mtu 1500 qdisc noqueue state UP mode DEFAULT group default qlen 1000
link/ether 66:59:d5:2d:62:7b brd ff:ff:ff:ff:ff:ff
7: v0@v1: <BROADCAST,MULTICAST,UP,LOWER_UP> mtu 1500 qdisc noqueue state UP mode DEFAULT group default qlen 1000
link/ether 16:b6:e1:98:ed:b9 brd ff:ff:ff:ff:ff:ff
16: eth0@if17: <BROADCAST,MULTICAST,UP,LOWER_UP> mtu 1500 qdisc noqueue state UP mode DEFAULT group default
link/ether 02:42:ac:11:00:02 brd ff:ff:ff:ff:ff:ff link-netnsid 0
root@eaa156967336:/# ip netns exec foo ip link show type veth
root@eaa156967336:/# ip netns exec bar ip link show type veth
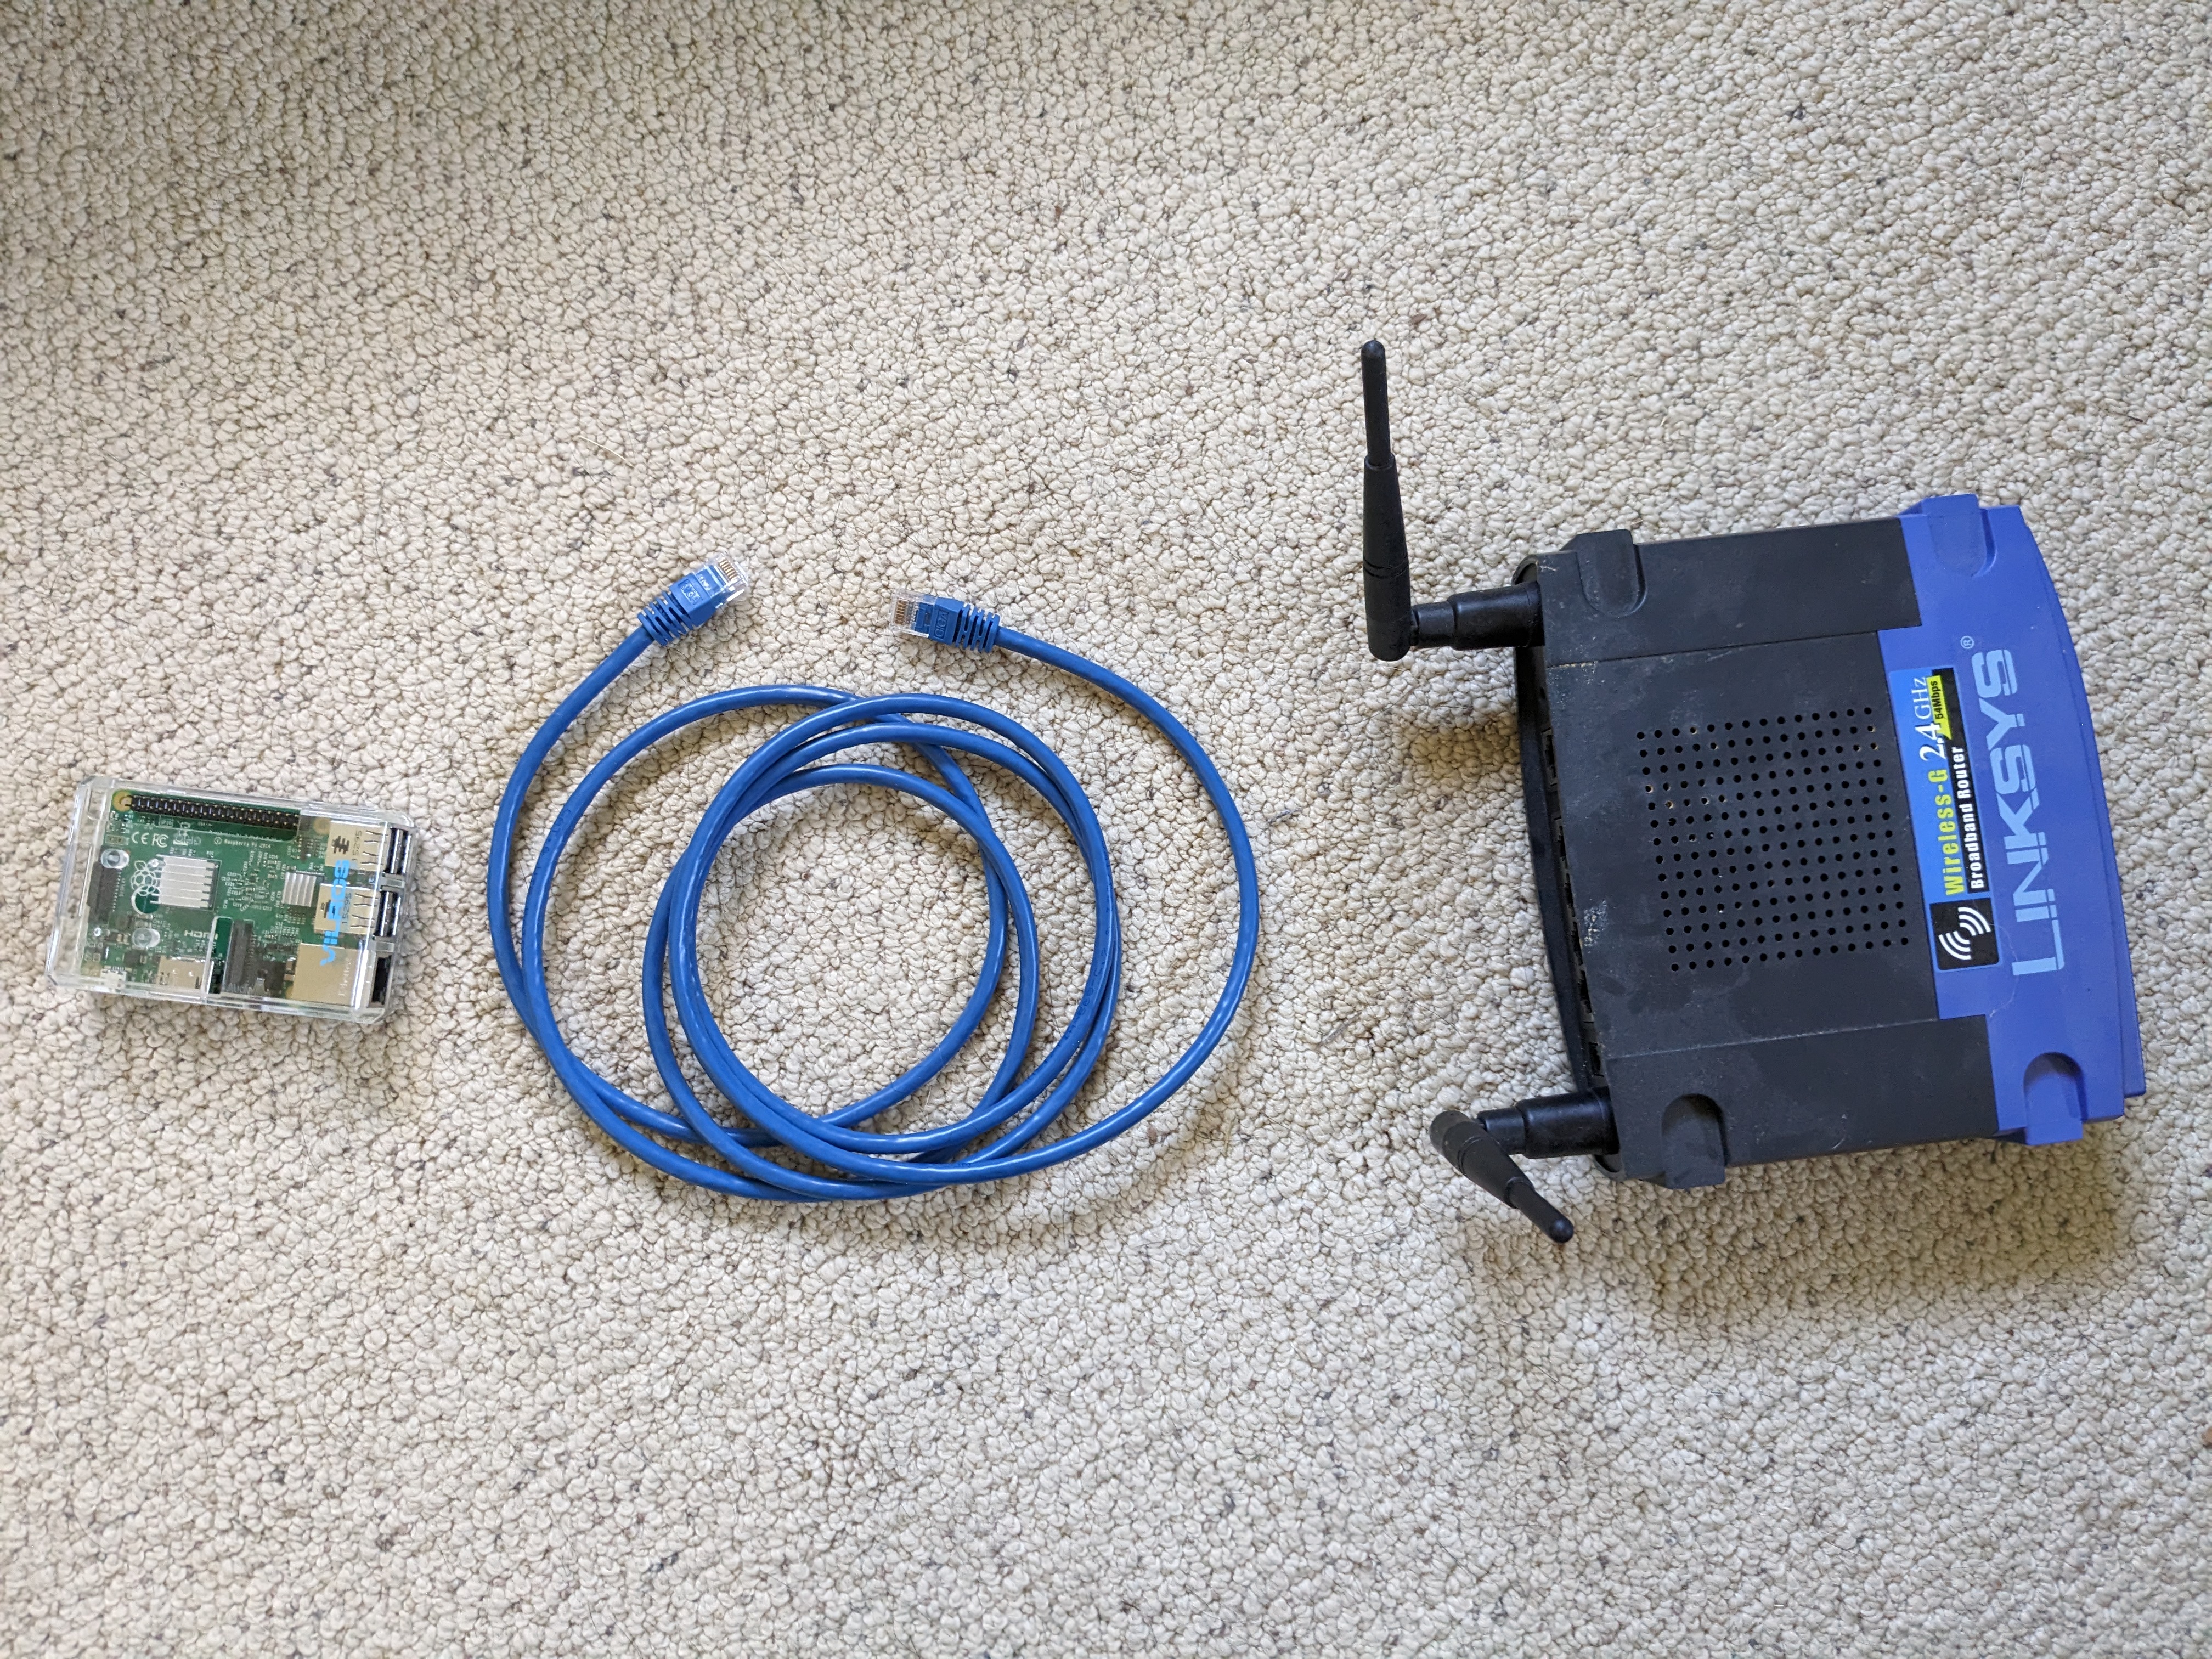
Our two namespaces have no virtual devices in them. Going back to our physical analogy, we now think of the Raspberry Pi and router as separate namespaces (virtual hosts). The cable is not yet connecting them (Figure 3.3).
We can move devices between namespaces with another option to ip link set:
root@eaa156967336:/# ip link set v0 netns foo
root@eaa156967336:/# ip link set v1 netns bar
root@eaa156967336:/# ip link show type veth
16: eth0@if17: <BROADCAST,MULTICAST,UP,LOWER_UP> mtu 1500 qdisc noqueue state UP mode DEFAULT group default
link/ether 02:42:ac:11:00:02 brd ff:ff:ff:ff:ff:ff link-netnsid 0
root@eaa156967336:/# ip netns exec foo ip link show type veth
7: v0@if6: <BROADCAST,MULTICAST> mtu 1500 qdisc noop state DOWN mode DEFAULT group default qlen 1000
link/ether 16:b6:e1:98:ed:b9 brd ff:ff:ff:ff:ff:ff link-netns bar
root@eaa156967336:/# ip netns exec bar ip link show type veth
6: v1@if7: <BROADCAST,MULTICAST> mtu 1500 qdisc noop state DOWN mode DEFAULT group default qlen 1000
link/ether 66:59:d5:2d:62:7b brd ff:ff:ff:ff:ff:ff link-netns foo
Now we see that v0 is no longer in the default namespace, but is
instead in foo, and similarly v1 is in bar. This is sometimes called
“throwing the device over the wall” into the namespace, because you no
longer have access to it from the initial (default) namespace.
In the foo namespace, the link v0 is unconfigured:
root@eaa156967336:/# ip netns exec foo ip addr show v0
7: v0@if6: <BROADCAST,MULTICAST> mtu 1500 qdisc noop state DOWN group default qlen 1000
link/ether 16:b6:e1:98:ed:b9 brd ff:ff:ff:ff:ff:ff link-netns bar
The same is true of v1 in bar. Let’s add addresses to the devices
and bring them up:
root@eaa156967336:/# ip netns exec foo ip addr add 1.2.3.4/32 dev v0
root@eaa156967336:/# ip netns exec bar ip addr add 1.2.3.5/32 dev v1
root@eaa156967336:/# ip netns exec foo ip link set v0 up
root@eaa156967336:/# ip netns exec bar ip link set v1 up
root@eaa156967336:/# ip netns exec foo ip addr show v0
7: v0@if6: <BROADCAST,MULTICAST,UP,LOWER_UP> mtu 1500 qdisc noqueue state UP group default qlen 1000
link/ether 16:b6:e1:98:ed:b9 brd ff:ff:ff:ff:ff:ff link-netns bar
inet 1.2.3.4/32 scope global v0
valid_lft forever preferred_lft forever
inet6 fe80::14b6:e1ff:fe98:edb9/64 scope link
valid_lft forever preferred_lft forever
root@eaa156967336:/# ip netns exec bar ip addr show v1
6: v1@if7: <BROADCAST,MULTICAST,UP,LOWER_UP> mtu 1500 qdisc noqueue state UP group default qlen 1000
link/ether 66:59:d5:2d:62:7b brd ff:ff:ff:ff:ff:ff link-netns foo
inet 1.2.3.5/32 scope global v1
valid_lft forever preferred_lft forever
inet6 fe80::6459:d5ff:fe2d:627b/64 scope link
valid_lft forever preferred_lft forever
At this point, we once again have the virtual equivalent of Figure 3.2, but now the Pi and router are virtual hosts.
3.7.2 Routing Between Namespaces
At this point, we have devices in foo and bar with addresses
1.2.3.4 and 1.2.3.5, and the devices are up and available for
traffic. What we do not yet have is a way for Linux to know how to
use these devices. We add this by modifying the routing tables for
the namespace.
Since foo and bar are directly connected by a single veth link,
we can do this fairly simply with the ip route add command:
root@eaa156967336:/# ip netns exec foo ip route add 1.2.3.5/32 dev v0 proto static scope global src 1.2.3.4
root@eaa156967336:/# ip netns exec bar ip route add 1.2.3.4/32 dev v1 proto static scope global src 1.2.3.5
root@eaa156967336:/# ip netns exec foo ip route
1.2.3.5 dev v0 proto static src 1.2.3.4
root@eaa156967336:/# ip netns exec bar ip route
1.2.3.4 dev v1 proto static src 1.2.3.5
There is a lot going on here. ip route add takes a CIDR prefix for
the destination, which in this case is just the address of the other
end of the link, the device through which to send traffic to this
destination, some “standard” options, and then the source address to
attach to traffic forwarded through this table entry. After doing this
for both namespaces, we can see that we now have routing tables with
the routes we just created.
The proof of the routing is in the pinging, so let’s give it a try:
root@eaa156967336:/# ip netns exec foo ping -c 3 1.2.3.5
PING 1.2.3.5 (1.2.3.5) 56(84) bytes of data.
64 bytes from 1.2.3.5: icmp_seq=1 ttl=64 time=0.023 ms
64 bytes from 1.2.3.5: icmp_seq=2 ttl=64 time=0.075 ms
64 bytes from 1.2.3.5: icmp_seq=3 ttl=64 time=0.107 ms
--- 1.2.3.5 ping statistics ---
3 packets transmitted, 3 received, 0% packet loss, time 2040ms
rtt min/avg/max/mdev = 0.023/0.068/0.107/0.034 ms
We have a working network!
Our network is not terribly useful, though. Let’s add a third namespace,
baz, and connect it to bar. ip netns add baz
ip netns exec baz ip link set lo up
ip link add v2 type veth peer name v3
ip link set v2 netns bar
ip link set v3 netns baz
ip netns exec bar ip addr add 1.2.3.5/32 dev v2
ip netns exec baz ip addr add 1.2.3.6/32 dev v3
ip netns exec bar ip link set v2 up
ip netns exec baz ip link set v3 up
ip netns exec bar ip route add 1.2.3.6/32 dev v2 proto static scope global src 1.2.3.5
ip netns exec baz ip route add 1.2.3.5/32 dev v3 proto static scope global src 1.2.3.6
What does our network now look like? root@eaa156967336:/# ip netns exec foo ip route
1.2.3.5 dev v0 proto static src 1.2.3.4
root@eaa156967336:/# ip netns exec bar ip route
1.2.3.4 dev v1 proto static src 1.2.3.5
1.2.3.6 dev v2 proto static src 1.2.3.5
root@eaa156967336:/# ip netns exec baz ip route
1.2.3.5 dev v3 proto static src 1.2.3.6
What about connectivity? root@eaa156967336:/# ip netns exec foo ping -c 3 1.2.3.5
PING 1.2.3.5 (1.2.3.5) 56(84) bytes of data.
64 bytes from 1.2.3.5: icmp_seq=1 ttl=64 time=0.046 ms
64 bytes from 1.2.3.5: icmp_seq=2 ttl=64 time=0.101 ms
64 bytes from 1.2.3.5: icmp_seq=3 ttl=64 time=0.044 ms
--- 1.2.3.5 ping statistics ---
3 packets transmitted, 3 received, 0% packet loss, time 2041ms
rtt min/avg/max/mdev = 0.044/0.063/0.101/0.026 ms
root@eaa156967336:/# ip netns exec foo ping -c 3 1.2.3.6
ping: connect: Network is unreachable
root@eaa156967336:/# ip netns exec bar ping -c 3 1.2.3.4
PING 1.2.3.4 (1.2.3.4) 56(84) bytes of data.
64 bytes from 1.2.3.4: icmp_seq=1 ttl=64 time=0.022 ms
64 bytes from 1.2.3.4: icmp_seq=2 ttl=64 time=0.271 ms
64 bytes from 1.2.3.4: icmp_seq=3 ttl=64 time=0.362 ms
--- 1.2.3.4 ping statistics ---
3 packets transmitted, 3 received, 0% packet loss, time 2035ms
rtt min/avg/max/mdev = 0.022/0.218/0.362/0.143 ms
root@eaa156967336:/# ip netns exec bar ping -c 3 1.2.3.6
PING 1.2.3.6 (1.2.3.6) 56(84) bytes of data.
64 bytes from 1.2.3.6: icmp_seq=1 ttl=64 time=0.061 ms
64 bytes from 1.2.3.6: icmp_seq=2 ttl=64 time=0.074 ms
64 bytes from 1.2.3.6: icmp_seq=3 ttl=64 time=0.079 ms
--- 1.2.3.6 ping statistics ---
3 packets transmitted, 3 received, 0% packet loss, time 2045ms
rtt min/avg/max/mdev = 0.061/0.071/0.079/0.007 ms
root@eaa156967336:/# ip netns exec baz ping -c 3 1.2.3.4
ping: connect: Network is unreachable
root@eaa156967336:/# ip netns exec baz ping -c 3 1.2.3.5
PING 1.2.3.5 (1.2.3.5) 56(84) bytes of data.
64 bytes from 1.2.3.5: icmp_seq=1 ttl=64 time=0.039 ms
64 bytes from 1.2.3.5: icmp_seq=2 ttl=64 time=0.073 ms
64 bytes from 1.2.3.5: icmp_seq=3 ttl=64 time=0.099 ms
--- 1.2.3.5 ping statistics ---
3 packets transmitted, 3 received, 0% packet loss, time 2056ms
rtt min/avg/max/mdev = 0.039/0.070/0.099/0.024 ms
From this, we can see that foo and bar can ping each other, as can
bar and baz. foo and baz, however, cannot.
If we look at our routing tables again, we can see at least part of
what the problem is: foo has no forwarding rule that applies to the
address 1.2.3.6, and baz has no forwarding rule that applies to
the address 1.2.3.4. We can add these, and see what changes:
ip netns exec foo ip route add 1.2.3.0/24 dev v0 proto static scope global src 1.2.3.4
ip netns exec baz ip route add 1.2.3.0/24 dev v3 proto static scope global src 1.2.3.6
Now we examine our routing tables and try to ping:
root@eaa156967336:/# ip netns exec foo ip route
1.2.3.0/24 dev v0 proto static src 1.2.3.4
1.2.3.5 dev v0 proto static src 1.2.3.4
root@eaa156967336:/# ip netns exec baz ip route
1.2.3.0/24 dev v3 proto static src 1.2.3.6
1.2.3.5 dev v3 proto static src 1.2.3.6
root@eaa156967336:/# ip netns exec foo ping -c 3 1.2.3.6
PING 1.2.3.6 (1.2.3.6) 56(84) bytes of data.
From 1.2.3.4 icmp_seq=1 Destination Host Unreachable
From 1.2.3.4 icmp_seq=2 Destination Host Unreachable
From 1.2.3.4 icmp_seq=3 Destination Host Unreachable
--- 1.2.3.6 ping statistics ---
3 packets transmitted, 0 received, +3 errors, 100% packet loss, time 2085ms
pipe 3
We still cannot connect foo and baz, but why not? When bar
receives a packet through device v1 with a destination of 1.2.3.6,
it does not actually know that it is supposed to forward it
further. That means it just ignores the packet, and it goes no
further. Instead, we need bar to act as a bridge between devices
v1 and v2. Without bridging, we would have to have point-to-point
links between all hosts in our network (called a mesh network). This
will work, but it becomes unmanageable, and is not appropriate for all
testing situations. We will look at adding bridges, but first we are
going to take a look at something useful even in small mesh networks.
3.7.3 Network Emulation
One of the additional programs in iproute2 is tc, which implements
traffic control. There is a lot you can do with this, but we are going
to limit ourselves to simple queueing discplines (qdisc). We can add
a queueing discipline to a device with
ip netns exec foo tc qdisc add dev v0 root handle 1:0 netem
This adds a new qdisc to foo’s v0 device, and configures it for
network emulation (netem). We can then update the qdisc to emulate
real network behaviors:
ip netns exec foo tc qdisc change dev v0 root netem delay 10ms rate 1Mbit loss random 30
Now the v0 device in the foo namespace will send traffic with a
latency of 10ms, a bandwidth of 1Mbps, and will randomly drop 30% of
the packets. This is one-way, so if we ping bar:
root@eaa156967336:/# ip netns exec foo ping -c 5 1.2.3.5
PING 1.2.3.5 (1.2.3.5) 56(84) bytes of data.
64 bytes from 1.2.3.5: icmp_seq=2 ttl=64 time=11.4 ms
64 bytes from 1.2.3.5: icmp_seq=3 ttl=64 time=13.5 ms
64 bytes from 1.2.3.5: icmp_seq=5 ttl=64 time=14.2 ms
--- 1.2.3.5 ping statistics ---
5 packets transmitted, 3 received, 40% packet loss, time 4086ms
rtt min/avg/max/mdev = 11.365/13.014/14.210/1.204 ms
We see RTTs slightly over 10ms because of the bandwidth limit. If we lower
the bandwidth to 100kbps, this becomes more pronounced:
root@eaa156967336:/# ip netns exec foo tc qdisc change dev v0 root netem delay 10ms rate 100kbit loss random 30
root@eaa156967336:/# ip netns exec foo ping -c 5 1.2.3.5
PING 1.2.3.5 (1.2.3.5) 56(84) bytes of data.
64 bytes from 1.2.3.5: icmp_seq=2 ttl=64 time=18.2 ms
64 bytes from 1.2.3.5: icmp_seq=3 ttl=64 time=18.4 ms
64 bytes from 1.2.3.5: icmp_seq=4 ttl=64 time=18.4 ms
64 bytes from 1.2.3.5: icmp_seq=5 ttl=64 time=18.0 ms
--- 1.2.3.5 ping statistics ---
5 packets transmitted, 4 received, 20% packet loss, time 4147ms
rtt min/avg/max/mdev = 18.002/18.249/18.442/0.167 ms
We are not seeing precisely 30% packet loss, because of the small sample size. If we increase this:
root@eaa156967336:/# ip netns exec foo ping -q -c 20 1.2.3.5
PING 1.2.3.5 (1.2.3.5) 56(84) bytes of data.
--- 1.2.3.5 ping statistics ---
20 packets transmitted, 14 received, 30% packet loss, time 19757ms
rtt min/avg/max/mdev = 18.259/19.568/22.042/1.315 ms
The -q flag makes ping “quiet”, printing only the summary at the end.
3.7.4 Adding Bridge Nodes
At this point, we can create mesh networks with realistic network link
emulation. We still do not have actual packet forwarding, however, so
now it is time to revisit bridging. Within the Linux kernel, a bridge
device allows externally facing devices, like our veth endpoints, to
interact through the routing table.1
The old way to create a bridge was with the brctl command. Here are
the steps to do this:
ip netns exec bar brctl addbr br0
ip netns exec bar ip addr add dev br0 local 1.2.3.5
ip netns exec bar ip link set dev br0 up
ip netns exec bar brctl addif br0 v1
ip netns exec bar brctl addif br0 v2
After executing these commands, we can communicate between foo and baz!
root@eaa156967336:/# ip netns exec foo ping -c 3 1.2.3.6
PING 1.2.3.6 (1.2.3.6) 56(84) bytes of data.
64 bytes from 1.2.3.6: icmp_seq=1 ttl=64 time=33.6 ms
64 bytes from 1.2.3.6: icmp_seq=2 ttl=64 time=19.3 ms
--- 1.2.3.6 ping statistics ---
3 packets transmitted, 2 received, 33.3333% packet loss, time 2009ms
rtt min/avg/max/mdev = 19.326/26.444/33.563/7.118 ms
The iproute2 package has a bridge command that replaces brctl, and
has additional functionality. We actually do not even need this to
create a simple bridge, as the ip command can do the basic
configuration”
ip netns exec bar ip link add name br0 type bridge
ip netns exec bar ip link set dev br0 up
ip netns exec bar ip link set dev v1 master br0
ip netns exec bar ip link set dev v2 master br0
This begins by creating a new device (br0) of type bridge. Once we
have brought the device up, we can set our virtual devices v1 and
v2 as subordinate to br0 with the master property. We can see
the bridge configuration with:
root@eaa156967336:/# ip netns exec bar bridge link show
6: v1@if7: <BROADCAST,MULTICAST,UP,LOWER_UP> mtu 1500 master br0 state forwarding priority 32 cost 2
9: v2@if8: <BROADCAST,MULTICAST,UP,LOWER_UP> mtu 1500 master br0 state forwarding priority 32 cost 2
Now we can create an arbitrary2 number of virtual hosts, with realistic forwarding tables and link characteristics. This allows us to test protocols in a wide variety of network configurations, including those that involve network failures or attacks.
Chapter 4 Interactions Between Layers
We have mostly looked at the OSI model’s layers independently, but when was the last time you typed an IP address into your web browser, not to mention a sequence of MAC addresses? Instead, we present a reasonable name at an appropriate layer, and rely on additional network services to convert this to the address used by the layer below or above.
4.1 Domain Name System
Let’s start with the one you are likely to see many times every day. This book is currently hosted on a server with IP address
128.8.127.4, but you almost certainly did not provide this address
directly to your browser. Instead, you would have entered (or followed
a link to) www.cs.umd.edu. This human-friendly name is not routable
by the network, so we need to get the associated IP address. How does
this work?
The Domain Name System (DNS) is a globally distributed database. Its primary (but not only) function is to provide mappings between
fully qualified domain names (FQDNs, such as www.cs.umd.edu) and
IP addresses (such as 128.8.127.4). Domain names are organized
hierarchically, beginning with the top-level domains (TLDs), and
delegating to registries. The TLDs are defined and managed by the
Internet Corporation for Assigned Names and Numbers (ICANN), as are
the country-code domains (such as .us).
Most applications that take FQDNs (ie, hostnames) perform DNS
lookups automatically. You can do this from the command line, as well,
which is often useful. Some systems still use an old program called
nslookup for this, but that has largely been deprecated in favor of
the programs host and dig.
Most of the time, host is the program you want to use. Given a FQDN,
it will tell you the IP address or addresses associated with it:
✔ 12:58:45 389Z $ host www.cs.umd.edu
www.cs.umd.edu is an alias for www-hlb.cs.umd.edu.
www-hlb.cs.umd.edu has address 128.8.127.4
In this case, the FQDN www.cs.umd.edu is an alias for another FQDN,
www-hlb.cs.umd.edu, so host retrieves the address record for this
as well. You can also perform reverse lookups, where you ask for
the FQDN matching an IP address:
✔ 13:00:47 389Z $ host 128.8.127.4
4.127.8.128.in-addr.arpa domain name pointer www-hlb.cs.umd.edu.
Here we actually perform a special DNS lookup in the in-addr.arpa
domain, with the order of the quads reversed. The reason for this is
that FQDNs begin with the host-specific part of the name and end with
the top-level domain, but IP addresses begin with the largest network
segment and end with the host-specific part of the address. Not all IP
addresses will have a reverse entry.
When you want to resolve a FQDN, you first contact your local resolver, also called a DNS server. The resolver should be set for you automatically when you join the network if you are using DHCP (Dynamic Host Configuration Protocol), which you almost always are. This local resolver maintains local information and a cache of retrieved DNS database records, and will recursively contact other resolvers for you if it does not know the requested information.
We are using “FQDN” rather than “hostname” deliberately here. While a
FQDN is a hostname, a hostname might not be a FQDN. In particular, a
host on your local network could be known simply by its short
hostname, such as www (on the CS department’s network):
✔ 13:00:51 389Z $ host www
www.cs.umd.edu is an alias for www-hlb.cs.umd.edu.
In this case, the local host appends its known domain to the requested hostname to obtain the FQDN for the DNS request.
There is another program called dig that does substantially the same
thing. The main difference is in the information displayed:
✔ 13:43:15 389Z $ dig www.cs.umd.edu
; <<>> DiG 9.10.6 <<>> www.cs.umd.edu
;; global options: +cmd
;; Got answer:
;; ->>HEADER<<- opcode: QUERY, status: NOERROR, id: 12444
;; flags: qr rd ra; QUERY: 1, ANSWER: 2, AUTHORITY: 0, ADDITIONAL: 1
;; OPT PSEUDOSECTION:
; EDNS: version: 0, flags:; udp: 512
;; QUESTION SECTION:
;www.cs.umd.edu. IN A
;; ANSWER SECTION:
www.cs.umd.edu. 11373 IN CNAME www-hlb.cs.umd.edu.
www-hlb.cs.umd.edu. 83373 IN A 128.8.127.4
;; Query time: 32 msec
;; SERVER: 10.72.14.49#53(10.72.14.49)
;; WHEN: Tue Nov 08 13:48:48 EST 2022
;; MSG SIZE rcvd: 81
We have been given a lot more information here, including all of the
options that were included in the request and a detailed breakdown of
the response. Comparing what we saw in the output from host, an
alias is resolved through a CNAME (“Canonical Name”) DNS record,
while an address is resolved through an A (“Address”) record. The
number that appears after the FQDN (which technically ends in a dot,
though you would not provide that as part of a hostname) is the time
to live for this record. Unlike the TTL of an IP packet, this TTL is
measured in seconds, and is how long the record may be cached before
it expires and should be retrieved again. In this case,
www.cs.umd.edu should be checked again in a little over 3 hours to
make sure it is still an alias for www-hlb.cs.umd.edu, which itself
should be checked in almost 14 hours to see if its IP address has
changed.
4.2 Network Blocks
As with the DNS hierarchy, the IP address space is also managed as a hierarchy. The largest network blocks (netblocks) are assigned by the Internet Assigned Numbers Authority (IANA), and those blocks are then subdivided by their respective owners. Some of this is publicly available, though as networks are divided into ever-smaller subnets, this information becomes purely internal.
We can learn a good deal about both domains and netblocks with the
whois program, which queries yet another distributed database. Here
is an example of a domain registration lookup:
✔ 14:17:29 389Z $ whois umd.edu
% IANA WHOIS server
% for more information on IANA, visit http://www.iana.org
% This query returned 1 object
refer: whois.educause.edu
domain: EDU
organisation: EDUCAUSE
address: 282 Century Place, Suite 5000
address: Louisville, CO 80027
address: United States
contact: administrative
name: Information Services Administration
organisation: EDUCAUSE
address: 4772 Walnut Street, Suite 206
address: Boulder Colorado 80301
address: United States
phone: +1-303-449-4430
fax-no: +1-303-440-0461
e-mail: netadmin@educause.edu
contact: technical
name: Registry Customer Service
organisation: VeriSign Global Registry
address: 12061 Bluemont Way
address: Reston Virginia 20190
address: United States
phone: +1-703-925-6999
fax-no: +1-703-948-3978
e-mail: info@verisign-grs.com
nserver: A.EDU-SERVERS.NET 192.5.6.30 2001:503:a83e:0:0:0:2:30
nserver: B.EDU-SERVERS.NET 192.33.14.30 2001:503:231d:0:0:0:2:30
nserver: C.EDU-SERVERS.NET 192.26.92.30 2001:503:83eb:0:0:0:0:30
nserver: D.EDU-SERVERS.NET 192.31.80.30 2001:500:856e:0:0:0:0:30
nserver: E.EDU-SERVERS.NET 192.12.94.30 2001:502:1ca1:0:0:0:0:30
nserver: F.EDU-SERVERS.NET 192.35.51.30 2001:503:d414:0:0:0:0:30
nserver: G.EDU-SERVERS.NET 192.42.93.30 2001:503:eea3:0:0:0:0:30
nserver: H.EDU-SERVERS.NET 192.54.112.30 2001:502:8cc:0:0:0:0:30
nserver: I.EDU-SERVERS.NET 192.43.172.30 2001:503:39c1:0:0:0:0:30
nserver: J.EDU-SERVERS.NET 192.48.79.30 2001:502:7094:0:0:0:0:30
nserver: K.EDU-SERVERS.NET 192.52.178.30 2001:503:d2d:0:0:0:0:30
nserver: L.EDU-SERVERS.NET 192.41.162.30 2001:500:d937:0:0:0:0:30
nserver: M.EDU-SERVERS.NET 192.55.83.30 2001:501:b1f9:0:0:0:0:30
ds-rdata: 28065 8 2 4172496CDE85534E51129040355BD04B1FCFEBAE996DFDDE652006F6F8B2CE76
whois: whois.educause.edu
status: ACTIVE
remarks: Registration information:
remarks: http://www.educause.edu/edudomain
created: 1985-01-01
changed: 2020-12-10
source: IANA
# whois.educause.edu
This Registry database contains ONLY .EDU domains.
The data in the EDUCAUSE Whois database is provided
by EDUCAUSE for information purposes in order to
assist in the process of obtaining information about
or related to .edu domain registration records.
The EDUCAUSE Whois database is authoritative for the
.EDU domain.
A Web interface for the .EDU EDUCAUSE Whois Server is
available at: http://whois.educause.edu
By submitting a Whois query, you agree that this information
will not be used to allow, enable, or otherwise support
the transmission of unsolicited commercial advertising or
solicitations via e-mail. The use of electronic processes to
harvest information from this server is generally prohibited
except as reasonably necessary to register or modify .edu
domain names.
-------------------------------------------------------------
Domain Name: UMD.EDU
Registrant:
University of Maryland
Division of Information Technology
Bldg 224, Room 3309-C
College Park, MD 20742
USA
Administrative Contact:
Domain Admin
University of Maryland
Division of Information Technology
Bldg 224, Room 3309-C
College Park, MD 20742-2411
USA
+1.3014053003
dnsadmin@noc.umd.edu
Technical Contact:
University of Maryland
Office of Information Technology
Network Operations Center
College Park, MD 20742
USA
+1.3014053003
dnstech@noc.umd.edu
Name Servers:
NS1.UMD.EDU
NS2.UMD.EDU
NS.UMS.EDU
Domain record activated: 31-Jul-1985
Domain record last updated: 26-Sep-2022
Domain expires: 31-Jul-2023
This is very long, and includes both the top-level (EDU-DOM)
registration and a recursive lookup in EDUCAUSE’s system. In both
cases, we get DNS resolvers (name servers) and points of contact. It
has become increasingly common for some of this information to be
hidden, particularly for smaller domains.
whois can also tell us the CIDR block for an address, and who owns
that block:
✔ 14:26:04 389Z $ whois 128.8.127.4
% IANA WHOIS server
% for more information on IANA, visit http://www.iana.org
% This query returned 1 object
refer: whois.arin.net
inetnum: 128.0.0.0 - 128.255.255.255
organisation: Administered by ARIN
status: LEGACY
whois: whois.arin.net
changed: 1993-05
source: IANA
# whois.arin.net
NetRange: 128.8.0.0 - 128.8.255.255
CIDR: 128.8.0.0/16
NetName: UMDNET-1
NetHandle: NET-128-8-0-0-1
Parent: NET128 (NET-128-0-0-0-0)
NetType: Direct Allocation
OriginAS: AS27
Organization: University of Maryland (UNIVER-262-Z)
RegDate: 1984-08-01
Updated: 2021-12-14
Ref: https://rdap.arin.net/registry/ip/128.8.0.0
OrgName: University of Maryland
OrgId: UNIVER-262-Z
Address: Office of Information Technology
Address: Patuxent Building
City: College Park
StateProv: MD
PostalCode: 20742
Country: US
RegDate: 2010-01-06
Updated: 2010-01-06
Ref: https://rdap.arin.net/registry/entity/UNIVER-262-Z
OrgTechHandle: UM-ORG-ARIN
OrgTechName: UMD DNS Admin Role Account
OrgTechPhone: +1-301-405-9955
OrgTechEmail: dnsadmin@noc.net.umd.edu
OrgTechRef: https://rdap.arin.net/registry/entity/UM-ORG-ARIN
OrgAbuseHandle: UARA-ARIN
OrgAbuseName: UMD Abuse Role Account
OrgAbusePhone: +1-301-405-8787
OrgAbuseEmail: abuse@umd.edu
OrgAbuseRef: https://rdap.arin.net/registry/entity/UARA-ARIN
RAbuseHandle: UARA-ARIN
RAbuseName: UMD Abuse Role Account
RAbusePhone: +1-301-405-8787
RAbuseEmail: abuse@umd.edu
RAbuseRef: https://rdap.arin.net/registry/entity/UARA-ARIN
RNOCHandle: UM-ORG-ARIN
RNOCName: UMD DNS Admin Role Account
RNOCPhone: +1-301-405-9955
RNOCEmail: dnsadmin@noc.net.umd.edu
RNOCRef: https://rdap.arin.net/registry/entity/UM-ORG-ARIN
RTechHandle: UM-ORG-ARIN
RTechName: UMD DNS Admin Role Account
RTechPhone: +1-301-405-9955
RTechEmail: dnsadmin@noc.net.umd.edu
RTechRef: https://rdap.arin.net/registry/entity/UM-ORG-ARIN
4.3 Layers 2 and 3
Consider the routing table we saw before:
crow@475283dd6ec2:/$ ip route
default via 172.17.0.1 dev eth0
172.17.0.0/16 dev eth0 proto kernel scope link src 172.17.0.2
This tells us that all of our outgoing packets should, by default, be
sent through the router with address 172.17.0.1. When we are
assembling the ethernet frame, we need to provide a MAC address, but
that is not the information we have. How do we get the MAC address for
an IP address on our local network?
The Address Resolution Protocol (ARP) allows us to learn these mappings, just as DNS allows us to learn the mappings between FQDNs and IP addresses. It works by broadcasting a message that says, “Who has this IP address I’m looking for? Please respond to me.” This is flooded through the local network until it reaches the host with that address, which then responds with its MAC address. The requesting host caches this information so that it does not need to send another ARP request for this IP address until the cache entry expires.
We can examine the current ARP cache with the arp program:
crow@9802b196582a:/$ arp
Address                  HWtype  HWaddress           Flags Mask            Iface
172.17.0.1               ether   02:42:ff:bc:4d:47   C                     eth0
This tells us the the address 172.17.0.1 corresponds to an ethernet
address 02:42:ff:bc:4d:47, and that we can reach this through the
eth0 device. There are additional arguments to perform a lookup,
manually add entries, or delete entries. The ARP table is maintained
in the file /proc/net/arp, which you can view using cat, but you
should never modify this file manually.
4.4 Scanning for Hosts and Ports
If you are going to scan a network, you must have the permission of:
- The network owner
- The owners of all hosts connected to the network
- All of the people using the network
Scanning a network without permission is a serious invasion of privacy, and in many cases might be illegal. If you just want to play with the tools we are looking at in this section, you can create a testbed using the commands from Section 3.7 and run them on that.
The nmap (https://nmap.org) program scans a host or subnet for open
ports. If it is able to connect to the port, it also attempts to
identify the host’s operating system, service, and version. There are a
lot of options, but we will only look at a few.
The simplest scan you can do is:
crow@9802b196582a:/$ nmap scanme.nmap.org
Starting Nmap 7.80 ( https://nmap.org ) at 2022-11-10 17:05 UTC
Nmap scan report for scanme.nmap.org (45.33.32.156)
Host is up (0.083s latency).
Other addresses for scanme.nmap.org (not scanned): 2600:3c01::f03c:91ff:fe18:bb2f
Not shown: 996 closed ports
PORT      STATE SERVICE
22/tcp    open  ssh
80/tcp    open  http
9929/tcp  open  nping-echo
31337/tcp open  Elite

Nmap done: 1 IP address (1 host up) scanned in 1.54 seconds
Here we see four TCP ports listening, with not much additional information provided.
We can add the -A flag gives us considerably more information:
crow@9802b196582a:/$ nmap -A scanme.nmap.org
Starting Nmap 7.80 ( https://nmap.org ) at 2022-11-10 17:07 UTC
Nmap scan report for scanme.nmap.org (45.33.32.156)
Host is up (0.094s latency).
Other addresses for scanme.nmap.org (not scanned): 2600:3c01::f03c:91ff:fe18:bb2f
Not shown: 996 closed ports
PORT      STATE SERVICE    VERSION
22/tcp    open  ssh        OpenSSH 6.6.1p1 Ubuntu 2ubuntu2.13 (Ubuntu Linux; protocol 2.0)
| ssh-hostkey:
|   1024 ac:00:a0:1a:82:ff:cc:55:99:dc:67:2b:34:97:6b:75 (DSA)
|   2048 20:3d:2d:44:62:2a:b0:5a:9d:b5:b3:05:14:c2:a6:b2 (RSA)
|   256 96:02:bb:5e:57:54:1c:4e:45:2f:56:4c:4a:24:b2:57 (ECDSA)
|_  256 33:fa:91:0f:e0:e1:7b:1f:6d:05:a2:b0:f1:54:41:56 (ED25519)
80/tcp    open  http       Apache httpd 2.4.7 ((Ubuntu))
|_http-server-header: Apache/2.4.7 (Ubuntu)
|_http-title: Go ahead and ScanMe!
9929/tcp  open  nping-echo Nping echo
31337/tcp open  tcpwrapped
Service Info: OS: Linux; CPE: cpe:/o:linux:linux_kernel

Service detection performed. Please report any incorrect results at https://nmap.org/submit/ .
Nmap done: 1 IP address (1 host up) scanned in 14.65 seconds
Now we are getting specifics about the actual programs and versions
that nmap was able to learn. We also have an inferred operating
system.
We can scan multiple hosts, which might be listed as separate command-line options or as CIDR blocks (which might take a while):
crow@9802b196582a:/$ nmap -T5 192.168.1.0/24
Starting Nmap 7.80 ( https://nmap.org ) at 2022-11-10 17:46 UTC
Warning: 192.168.1.156 giving up on port because retransmission cap hit (2).
Nmap scan report for 192.168.1.0
Host is up (0.014s latency).
All 1000 scanned ports on 192.168.1.0 are closed

Nmap scan report for Fios_Quantum_Gateway.fios-router.home (192.168.1.1)
Host is up (0.017s latency).
Not shown: 992 closed ports
PORT     STATE    SERVICE
22/tcp   filtered ssh
53/tcp   open     domain
80/tcp   open     http
443/tcp  open     https
4567/tcp filtered tram
8022/tcp filtered oa-system
8080/tcp open     http-proxy
8443/tcp open     https-alt

Nmap scan report for Mikes-MBP.fios-router.home (192.168.1.156)
Host is up (0.0046s latency).
Not shown: 999 closed ports
PORT     STATE    SERVICE
7937/tcp filtered nsrexecd

Nmap scan report for 192.168.1.184
Host is up (0.023s latency).
Not shown: 997 closed ports
PORT     STATE SERVICE
22/tcp   open  ssh
443/tcp  open  https
5000/tcp open  upnp

Nmap scan report for celephais.fios-router.home (192.168.1.195)
Host is up (0.037s latency).
Not shown: 999 closed ports
PORT     STATE SERVICE
4000/tcp open  remoteanything

Nmap scan report for WyzeCam.fios-router.home (192.168.1.201)
Host is up (0.015s latency).
All 1000 scanned ports on WyzeCam.fios-router.home (192.168.1.201) are closed

Nmap scan report for WyzeCam.fios-router.home (192.168.1.202)
Host is up (0.014s latency).
All 1000 scanned ports on WyzeCam.fios-router.home (192.168.1.202) are closed

Nmap scan report for 192.168.1.205
Host is up (0.0068s latency).
Not shown: 997 closed ports
PORT     STATE SERVICE
53/tcp   open  domain
80/tcp   open  http
7777/tcp open  cbt

Nmap scan report for Pixel-6a.fios-router.home (192.168.1.211)
Host is up (0.017s latency).
All 1000 scanned ports on Pixel-6a.fios-router.home (192.168.1.211) are closed

Nmap scan report for 192.168.1.255
Host is up (0.033s latency).
All 1000 scanned ports on 192.168.1.255 are closed

Nmap done: 256 IP addresses (10 hosts up) scanned in 10.10 seconds
This is my home network. We have omitted the -A option, but added
-T5, which sets it to do the fastest scan it can. We see my work
laptop, my personal laptop, my router, two webcams, the subnet
broadcast address, and some other stuff.
What is this other stuff on my network?
crow@9802b196582a:/$ nmap -A 192.168.1.184 192.168.1.205
Starting Nmap 7.80 ( https://nmap.org ) at 2022-11-10 18:02 UTC
Nmap scan report for 192.168.1.184
Host is up (0.011s latency).
Not shown: 997 closed ports
PORT     STATE SERVICE  VERSION
22/tcp   open  ssh      OpenSSH 7.1 (protocol 2.0)
| ssh-hostkey:
|   2048 06:ff:63:a5:ca:87:fe:4b:df:50:19:1d:8a:05:85:66 (RSA)
|   256 3b:24:08:80:33:08:52:66:2b:8f:a8:d0:a1:ee:fb:7c (ECDSA)
|_  256 c6:49:68:73:23:60:aa:e4:57:ab:6e:52:6f:14:2c:98 (ED25519)
443/tcp  open  ssl/http Neato Botvac Connected
|_http-title: Site doesn't have a title.
| ssl-cert: Subject: commonName=Lennox/organizationName=Lennox International Inc./stateOrProvinceName=TX/countryName=US
| Not valid before: 2016-11-07T12:22:46
|_Not valid after:  2116-10-14T12:22:46
|_ssl-date: TLS randomness does not represent time
| sslv2:
|   SSLv2 supported
|_  ciphers: none
5000/tcp open  upnp?
Service Info: Device: specialized

Nmap scan report for 192.168.1.205
Host is up (0.068s latency).
Not shown: 997 closed ports
PORT     STATE SERVICE VERSION
53/tcp   open  domain  ISC BIND 9.11.35
| dns-nsid:
|_  bind.version: 9.11.35
80/tcp   open  http    Arris TG862G http config
| http-auth:
| HTTP/1.1 401 Unauthorized\x0D
|_  Basic realm=NETGEAR WAC104
|_http-title:  Authorization warning
7777/tcp open  upnp    MiniUPnP 1.6 (Netgear SDK 4.2.0.0; UPnP 1.0)
Service Info: Device: WAP; CPE: cpe:/h:arris:tg862g

Service detection performed. Please report any incorrect results at https://nmap.org/submit/ .
Nmap done: 2 IP addresses (2 hosts up) scanned in 179.92 seconds
By adding -A for just the two unknown hosts, we see more detail. One
of the hosts is my WiFi access point (a layer 2 device), and the other
is presumably the controller for my furnace and air conditioner (which
allows ssh connections, for some reason).
Chapter 5 Network Programming
Most programming languages have some way of interacting with the network, with varying degrees of abstraction. We will focus on using C, because it exposes the network connections with considerably more detail than other languages, so you will become more familiar with these details by writing networking code in C. Once you are familiar with network programming in C, transferring that knowledge to another language that provides a “friendlier” abstraction will be much easier.
5.1 Socket Programming
A socket is an abstraction used by the operating system to treat one end of an inter-process communications link as a file. Like other files, a process can read from or write to a socket. Unlike other files, a socket is specifically bound to a single process, so only that process has access to the socket.
We commonly have three types of sockets: stream, datagram, and raw. Stream sockets instantiate the TCP protocol. Datagram sockets instantiate the UDP protocol. Raw sockets do not have a layer 4 protocol abstraction, so it is up to the application to handle any necessary layer 4 processing. Creating raw sockets is a protected operation, and can only be done by a user with root privileges. You will rarely work with raw sockets, and then only for very low-level operations. As an application developer, you will mostly use TCP and UDP, as discussed in Section 3.1.
5.1.1 Creating a socket
The programming interface for sockets in C is defined in the header
file sys/socket.h (or files included by it). You include it as you
would any header file:
#include <sys/socket.h>
As mentioned previously, Linux (and many other operating systems) treat a socket as a special kind of file. That means creating a socket is a similar operation to opening a file, with the basic function being
int sockfd = socket(PF_INET, SOCK_STREAM, 0);
The arguments to socket() tell the kernel the desired protocol
family (PF_INET is IPv4), socket type (SOCK_STREAM is TCP), and
protocol (0 for TCP, because there is only one protocol supported
for this type of socket). For SOCK_DGRAM (UDP), we would also
specify 0 for the protocol. There are other, less common, socket
types that might require a protocol. See the documentation for details
if you are curious.
The value returned by socket() is a file descriptor. This is just
an integer, much like the file descriptors for standard input (0), standard
output (1), and standard error (2). On failure, socket() instead returns
-1, so you should always check the returned value. If socket()
returns -1, then it will also set the errno global variable to indicate
the cause of the failure. See the documentation for a list of these, but
often a failed socket creation is a fatal error for a program.
The documentation might show AF_INET in the place of PF_INET,
depending on where you look. These constants should have the same
value, but technically AF_INET refers to the IPv4 address family,
rather than the protocol family. It is largely a matter of style which
you use, but we will use PF_INET when specifying a protocol family
and AF_INET when specifying an address family, just to keep these
concepts clear and separate.
5.1.2 Socket options
When created, a socket has some default set of options, depending on
the type of socket and protocol. Often, these defaults are appropriate,
but sometimes you will need to change them for your program to work
as intended. We can change these options with setsockopt(), as
illustrated here:
int opt = 1;
setsockopt(sockfd, SOL_SOCKET, SO_REUSEADDR, &opt, sizeof(opt));
Here the sockfd is what was returned by socket(). SOL_SOCKET
indicates that we are setting a socket-level (as opposed to
protocol-level) option. The specific option we are setting is
SO_REUSEADDR, which controls whether we want the operating system to
reuse the associated port before the standard timer expires. This is
somewhat dangerous in certain circumstances, because you are allowing
a new process to claim your port number after you exit, meaning they
can potentially receive traffic that was intended for you. The last
two arguments are the option itself, and how many bytes it is. Note
that we are providing a pointer, rather than just the literal number
1. We have to do this because not all options take an integer. Some
might actually take arrays or structures, so it is important to let
setsockopt() know how much data we are providing for the option.
We mentioned that SOL_SOCKET is for socket-level options. We can
also specify options for TCP (IPPROTO_TCP) or UDP (IPPROTO_UDP),
if we want to adjust the behavior of those. If you are writing an
interactive TCP program, for instance, you might want to specify the
TCP_NODELAY option to disable TCP’s buffering of small chunks of
data. It is extremely unlikely that you will want or need to do
this, however, and you should definitely take a course on computer
networking (such as CMSC417) before using this option, so that you
know the implications of disabling the delays.
5.1.3 Socket addresses
At this point, we have created a socket, but we cannot do anything with it yet. We have two choices:
- We can wait for someone to connect to us, or
- We can try to connect to someone else.
Either way, we need to add a socket address to the socket. For the first case (a server), this determines who is able to connect to us. For the second case (a client), this specifies the server we are trying to contact.
There are two structures we will look at: sockaddr and
sockaddr_in. Why do we have two? Actually, we have many more, but
these are the only two we will worry about, and the others should be
fairly clear from these. In simple terms, sockaddr is a generic
socket address, akin to a base class in an object-oriented language;
while sockaddr_in is a socket address specific to the IPv4 protocol
(in for “internet”), akin to a subclass of sockaddr. Functions that take a socket address generally take a pointer to a
sockaddr, but if we want to set or read specific fields, we need
to use a structure like sockaddr_in.
Many of the fields in sockaddr_in will be 0, so we generally begin
by making everything 0, and then setting what we need:
struct sockaddr_in server_addr;
memset(&server_addr, 0, sizeof(server_addr));
The memset() function allows you to set all of the bytes in some
structure (treated as a simple byte array) to a single value. In this
case, that value is 0. By passing our server_addr with an
ampersand, memset() is receiving it as an address; that is, as a
pointer (a void* here, more specifically). Because memset() knows
nothing about the destination other than that it’s a pointer, we have
to tell it how many bytes to overwrite with 0, which is why we pass
sizeof(server_addr) as the last argument. This is the size of the
actual structure, in bytes.
Now that we have an empty server_addr, it is time to set the fields
that matter. There are generally three that we care about:
-
server_addr.sin_familyis the address family. For asockaddr_in, this will usually beAF_INET(the IPv4 address family). -
server_addr.sin_portis the port on which we will listen for connections. If this were a client, this would be the port on the server to connect to. -
server_addr.sin_addr.s_addris the relevant IP address.For a server, this will generally be
INADDR_ANY(to listen for connections from any host on the network) orINADDR_LOOPBACK(to only listen for connections coming from this host over the loopback device). We can, however, specify the IP address bound to a specific device to allow connections from outside of this host, but only on that device. This is useful for multi-homed servers, which are connected to two or more layer 2 networks.For a client, this would be the address of the server we are connecting to.
An important thing to note is that ports and addresses must be in network byte order. This is always big-endian, regardless of the operating system’s byte ordering. That means your code should always convert numbers to the appropriate ordering, unless you are guaranteed to have received them in network byte order. We will see examples of this later. For a detailed discussion of byte ordering, see the General Systems Handbook.
5.1.4 Servers
A server is a process that provides some service to client processes via the network. This might be serving web pages, providing hostname resolution, uploading or downloading files, or just about anything else. There will be slightly different workflows for a server depending on whether it is using TCP or UDP.
TCP Server
We will start with the workflow for a TCP server, as illustrated by the following code:
#include <sys/socket.h>
#include <stdio.h>
#include <stdint.h>
#include <string.h>
#include <endian.h>
#include <unistd.h>
#include <netinet/in.h>
#include <error.h>
#include <errno.h>

int main(int argc, char** argv) {
   // 1. Create a socket.
   int sockfd;
   sockfd = socket(PF_INET, SOCK_STREAM, 0);
   if ( sockfd < 0 ) {
      fprintf(stderr, "Socket creation failed with error %d\n", errno);
      return 1;
   }

   int e;

   // 2. Bind a port to the socket.
   uint16_t port = 1234;
   struct sockaddr_in server_addr;
   memset(&server_addr, 0, sizeof(server_addr));
   server_addr.sin_family = AF_INET;
   server_addr.sin_port = htobe16(port);
   server_addr.sin_addr.s_addr = INADDR_ANY;
   e = bind(sockfd, (struct sockaddr*)&server_addr, sizeof(server_addr));
   if ( e < 0 ) {
      fprintf(stderr, "Binding port %d failed with error %d\n", port, errno);
      return 1;
   }

   // 3. Configure the socket to listen for new connections.
   e = listen(sockfd, 5);
   if ( e < 0 ) {
      fprintf(stderr, "Listening failed with error %d\n", errno);
      return 1;
   }


   while ( 1 ) {
      // 4. Accept a new connection.
      struct sockaddr_in client_addr;
      socklen_t client_addr_len = sizeof(client_addr);
      int clientfd = accept(sockfd,
			    (struct sockaddr*)(&client_addr),
			    &client_addr_len);
      if ( clientfd < 0 ) {
         fprintf(stderr, "Accept failed with error %d\n", errno);
	 return 1;
      }

      // 5. Exchange data with the client on the new socket.
      unsigned char buf[1024];
      int n = recv(clientfd, buf, sizeof(buf), 0);
      if ( n < 0 ) {
         fprintf(stderr, "Reading from client failed with error %d\n", errno);
	 return 1;
      }

      // 6. Close the client's socket.
      close(clientfd);
   }
   return 0;
}
Let’s go through these steps one-by-one:
- We first create a socket. If you have socket options to set, you will do that here, as well.
- Next, we specify how this socket should receive new connections, in a
process called binding. The
bind()function takes a socket file descriptor, a pointer to astruct sockaddr, and the size of the actual structure pointed to by the second argument. Note that when we create ourstruct sockaddr_in, we convert the port number to network byte order withhtobe16(port). - Now we have to tell the socket that it is ready for new connections, with
listen(). This takes the socket file descriptor, as well as a backlog, which is how many new connections will be buffered in a queue while waiting for the next step. Additional connections while the queue is full will fail withECONNREFUSED(Error: Connection Refused). - When a new connection is available, the
accept()function creates a new socket. It also provides the caller with the socket address of the connecting client by filling in the structure pointed to in the second argument. As before, since there can be different types of sockets with different types of socket addresses, we have to provide a pointer to an integer (which is whatsocklen_tis) so thataccept()knows how much space is available and can fill it in with the actual size stored. - Now the client socket is ready to exchange data with the client. We will explore this in more detail in Section 5.2.
- Finally, when we are finished with the client, we call
close()on the client’s socket file descriptor.
Note that we have error-handling blocks after each of these function
calls (except close()). These are important: There are many reasons
why one of these functions might produce an error, and it is important
to understand what these error are. Some are fatal (the program should
terminate), and some are not. It is possible for accept() or data
transfer to produce a non-fatal error, though they might require
terminating the client connections. Some data transfer errors just
need to be attempted again later, as we will see.
As written, this code only handles connections from one client at a time. This is usually not what we want, so we need some way to multiplex our client connections. The easiest (but extremely limiting) way to do this is to either fork the process or create a new thread for each client. We will see a much better option in Section 5.1.6.
UDP Server
We now look at the workflow for a UDP server. This will be somewhat similar to our TCP server, but there will be differences, due to the fact that TCP is connection-oriented, while UDP is connectionless. That is, TCP maintains some state (data, status, etc.) for a client connection, while UDP does not.
Here is our UDP server code:
#include <sys/socket.h>
#include <stdio.h>
#include <stdint.h>
#include <string.h>
#include <endian.h>
#include <unistd.h>
#include <netinet/in.h>
#include <errno.h>

int main(int argc, char** argv) {
   // 1. Create a socket.
   int sockfd;
   sockfd = socket(PF_INET, SOCK_DGRAM, 0);
   if ( sockfd < 0 ) {
      fprintf(stderr, "Socket creation failed with error %d\n", errno);
      return 1;
   }

   int e;

   // 2. Bind a port to the socket.
   uint16_t port = 1234;
   struct sockaddr_in server_addr;
   memset(&server_addr, 0, sizeof(server_addr));
   server_addr.sin_family = AF_INET;
   server_addr.sin_port = htobe16(port);
   server_addr.sin_addr.s_addr = INADDR_ANY;
   e = bind(sockfd, (struct sockaddr*)&server_addr, sizeof(server_addr));
   if ( e < 0 ) {
      fprintf(stderr, "Binding port %d failed with error %d\n", port, errno);
      return 1;
   }

   while ( 1 ) {
      // 3. Receive data from a client.
      unsigned char buf[1024];
      struct sockaddr_in client_addr;
      struct sockaddr* caddr = (struct sockaddr*)(&client_addr);
      socklen_t client_addr_len = sizeof(client_addr);
      int n;
      n = recvfrom(sockfd, buf, sizeof(buf), 0, caddr, &client_addr_len);
      if ( n < 0 ) {
         fprintf(stderr, "Receiving from client failed with error %d\n", errno);
	 return 1;
      }

      // 4. Send a reply to the client.
      n = sendto(sockfd, buf, n, 0, caddr, client_addr_len);
      if ( n < 0 ) {
         fprintf(stderr, "Sending to client failed with error %d\n", errno);
      }
   }
   return 0;
}
Aside from changing the type of socket from SOCK_STREAM to
SOCK_DGRAM in the socket() call, the first two steps are the
same. The biggest change is that we no longer have to listen() for
and accept() connections. Instead, we use recvfrom() to receive a
datagram (a single UDP packet payload) from a client, storing the
address of the client so that we can send a reply, if
needed. Essentially, we have combined the accept() and recv()
functions, capturing the client’s address when we read data, rather
than before we are ready to read data. We also show the sendto()
function, which uses the client address from recvfrom() to determine
its destination. Again, we will examine these functions in greater
detail in Section 5.2. Since each client is using the
main socket, we do not close the socket when we are done providing
service to a client.
5.1.5 Clients
A client, at its core, is a process that requests service from a server. This is easiest to understand by example. Here are some clients you might be familiar with:
- Web browser
- Discord app
- Online game app
All of these connect to some remote host, the server, and interact with it. host, dig, and whois are also clients, and we saw netcat operating as
both a server and a client.
The biggest difference between a server and a client is that a server
is waiting for connections from other hosts (with accept()), while a
client initiates connections to other hosts. As an additional wrinkle,
there are some processes that both initiate connections and receive
connections. These might be performing different roles (you connect
via a browser client to a web server, which connects as a client to a
database server), or they might be acting as peers. While we will
not go into details about peer-to-peer applications, once you
understand how clients and servers work, it is a fairly simple
extrapolation (though the protocols themselves can be somewhat
complex).
TCP Client
Again, we begin with the TCP version of the client. Here is our code:
#include <sys/socket.h>
#include <stdio.h>
#include <stdint.h>
#include <string.h>
#include <unistd.h>
#include <endian.h>
#include <netdb.h>
#include <errno.h>

int main(int argc, char** argv) {
   // 1. Read the server address and port from the command line.
   if ( argc < 3 ) {
      fprintf(stderr, "Usage: %s <server> <port>\n",argv[0]);
      return 1;
   }

   struct addrinfo hints;
   struct addrinfo* addrlist;
   memset(&hints, 0, sizeof(hints));
   hints.ai_family = PF_UNSPEC;
   hints.ai_socktype = SOCK_STREAM;
   if ( getaddrinfo(argv[1], argv[2], &hints, &addrlist) ) {
      fprintf(stderr, "Error looking up %s:%s\n",argv[1],argv[2]);
      return 1;
   }
   if ( NULL == addrlist ) {
      fprintf(stderr, "No address found for %s:%s\n",argv[1],argv[2]);
      return 1;
   }

   // 2. Create a socket.
   int sockfd;
   sockfd = socket(addrlist->ai_family,
                   addrlist->ai_socktype,
		   addrlist->ai_protocol);
   if ( sockfd < 0 ) {
      fprintf(stderr, "Socket creation failed with error %d\n", errno);
      return 1;
   }

   int e;

   // 3. Connect to the server.
   e = connect(sockfd, addrlist->ai_addr, addrlist->ai_addrlen);
   if ( e < 0 ) {
      fprintf(stderr, "Could not connect\n");
      return 1;
   }

   // 4. Exchange data with the server.
   int n = send(sockfd, "hello", 6, 0);
   if ( n < 0 ) {
      fprintf(stderr, "Sending to server failed with error %d\n", errno);
      return 1;
   }

   // 5. Close the socket.
   close(sockfd);

   return 0;
}
Here we see a rather different workflow than we had in our server:
- First, we take the command-line arguments and use them to obtain
the
struct sockaddr*for the server.argv[0]is always the process name, so here we assumeargv[1]holds the hostname, andargv[2]holds the port. We are usinggetaddrinfo(), and letting it figure out the appropriate address type, limiting ourselves to TCP sockets (SOCK_STREAM). Note that this code will work whether the server is running IPv4 or IPv6, since we have left the protocol family unspecified (PF_UNSPEC). This is a good idea in your client code, and will make your code more portable to different network environments.getaddrinfo()returns 0 on success, and creates a linked list in its last argument, which is why we are passing a pointer to a pointer (this is a very common design). - Next, we create a socket to the server. Here we rely on what
getaddrinfo()has returned to us. Since we really only expect one result, and only care about out, we ignore the linked-list nature ofaddrlist, and just use the first entry. You could create a loop over the linked list, if you expect multiple results, only some of which might respond. - For our network functions, this is the first major difference between the
client and server. Where the server calls
bind(),listen(), andaccept(), the client just callsconnect(). This takes a socket address pointer and the length of the structure, and again we can get these directly fromaddrlist. - As before, we now are ready to exchange data with the server. Here we see
the
send()function, which is the complement of therecv()in the server. - When we are done with the socket, we again call
close()on it.
UDP Client
Now we will take a look at the UDP version of our client:
#include <sys/socket.h>
#include <stdio.h>
#include <stdint.h>
#include <string.h>
#include <endian.h>
#include <netdb.h>
#include <errno.h>
#include <unistd.h>

int main(int argc, char** argv) {
   // 1. Read the server address and port from the command line.
   if ( argc < 3 ) {
      fprintf(stderr, "Usage: %s <server> <port>\n",argv[0]);
      return 1;
   }

   struct addrinfo hints;
   struct addrinfo* addrlist;
   memset(&hints, 0, sizeof(hints));
   hints.ai_family = PF_UNSPEC;
   hints.ai_socktype = SOCK_DGRAM;
   if ( getaddrinfo(argv[1], argv[2], &hints, &addrlist) ) {
      fprintf(stderr, "Error looking up %s:%s\n",argv[1],argv[2]);
      return 1;
   }
   if ( NULL == addrlist ) {
      fprintf(stderr, "No address found for %s:%s\n",argv[1],argv[2]);
      return 1;
   }

   // 2. Create a socket.
   int sockfd;
   sockfd = socket(addrlist->ai_family,
                   addrlist->ai_socktype,
		   addrlist->ai_protocol);
   if ( sockfd < 0 ) {
      fprintf(stderr, "Socket creation failed with error %d\n", errno);
      return 1;
   }

   // 3. Exchange data with the server.
   int n = sendto(sockfd, "hello", 6, 0,
		  addrlist->ai_addr,
		  addrlist->ai_addrlen);
   if ( n < 0 ) {
      fprintf(stderr, "Sending to server failed with error %d\n", errno);
      return 1;
   }

   // 4. Close the socket.
   close(sockfd);

   return 0;
}
This is almost identical to the TCP client. Instead of SOCK_STREAM,
we specify SOCK_DGRAM for the socket type in the hints to
getaddrinfo(). We remove the call to connect(), since UDP is
connectionless. We also replace the call to send() with sendto(),
which now includes the server’s address info.
5.1.6 Efficient Multiplexing
As previously mentioned, we can multiplex connections within a server using separate threads or processes for each client. This ends up wasting resources, however, and switching between threads may be fast, but it is not instantaneous.
A better solution is to make our sockets non-blocking, and use either
select() or poll() to tell us when they are ready for reading or
writing. We can make a socket non-blocking with:
#include <fcntl.h>
fcntl(sockfd, F_SETFL, O_NONBLOCK);
This will mostly apply to TCP, but we can also use these techniques if we have multiple UDP ports open, a mix of TCP and UDP, or if we are also accepting input from standard input (file descriptor 0).
When we call send() or recv(), and there is not yet enough data to
read, the functions will usually block. That is, they will not return
until they have completed the request. By making the socket
non-blocking, these functions will instead return -1 (indicating an
error), and set errno to EAGAIN or EWOULDBLOCK (which might, and
often will, be same value).
As we mentioned above, we can use select() or poll() to tell us
when a socket is ready for a particular operation (typically reading
or writing). These functions are similar, but have (for us)
essentially the same functionality. They block until:
- a file descriptor is ready, or
- a timeout expires, or
- an error occurs.
The main difference (again, for us), is how the file descriptors and timeout are provided.
In both cases, we will modify the server workflow from what we had in Section 5.1.4.1:
- If we are reading from the listening socket, we will call
acceptand add the client information to the set of file descriptors to watch. (step 4) - If we are reading from or writing to a client socket, we will exchange as much data as we safely can without blocking. (step 5)
- If a
sendorrecvon a client socket returns0, we will close the socket. (step 6)
Select
For select(), we specify three file descriptor sets, any of which might
be NULL, and a pointer to a timeval with the timeout information, which
might also be NULL. Here is some (incomplete) example code:
#include <sys/select.h>
#include <sys/time.h>

fd_set read_set, write_set, err_set;
timeval timeout;
timeout.tv_sec = 1;
timeout.tv_usec = 0;

while(1) {
   FD_ZERO(&read_set);
   FD_ZERO(&write_set);
   FD_ZERO(&err_set);
   FD_SET(sockfd, &read_set);

   int nfd = select(sockfd+1, &read_set, &write_set, &err_set, &timeout);
   if ( 0 < nfd ) {
      if ( FD_ISSET(sockfd, &read_set) ) {
         ...
      }
   } else if ( -1 == nfd ) { ... }
}
fd_set is basically a bitmap of possible file descriptors, and we
operate on it with a set of macros FD_ZERO, FD_SET, and
FD_ISSET, all of which expect a pointer to an fd_set. We must
clear each set before calling select, which we do with FD_ZERO. Then
we specify which file descriptors to watch in a set with
FD_SET. Once select() returns, we can test if a particular
descriptor has been set with FD_ISSET.
We have to tell select() how many file descriptors it should be
looking at. Since fd_set is a bitmap, this number is the greatest
file descriptor number, plus 1. That is, it is the effective length of
the bitmap that includes all of our file descriptors. This is the
first argument to select(), followed by the read set, the write set,
the error set, and the timeout. The return value from select() is
the number of file descriptors with something matching from any of the
sets, or -1 if there was an error.
timeval has two fields, specifying number of seconds (tv_sec) and
microseconds (tv_usec). If the timeout is 0 (in both fields), select()
will always return immediately. If it is NULL, then select() will not
return until one of the specified file descriptor sets is ready.
What does “ready” mean? For the read set, it means there is a file descriptor in that set that currently has data we can read. This is the most common case (aside from timeouts). For the write set, “ready” means that a file descriptor in that set is ready to receive more data from us. This might arise when we attempted to write to a socket, but it had no more room in its buffer. Once the buffer has cleared sufficiently, it will return as ready for writing. For the error set, “ready” means there was an out-of-band error that we cannot detect by reading or writing, so we need to check for it. This might be due to the socket being closed.
While it is common for the timeout to be NULL (often with only the
read set non-NULL), there are times when everything except the
timeout is NULL. Why would we do this? The reason is that C
provides us with a sleep() function, which takes an integer number
of seconds. If we want to sleep for less than a second, or some other
fractional value, we need a different mechanism, and select()
provides us with this. For example, to sleep for half a second we
could do:
timeval timeout;
timeout.tv_sec = 0;
timeout.tv_usec = 500000;
select(0,NULL,NULL,NULL,&timeout);
Because we have not told select() to monitor any file descriptors,
this will wait until the timeout expires, doing nothing else until
then.
Poll
The poll() function scales better than select(), though for most
applications this will not make a substantial difference. Rather than
a set of bitmaps, it takes an array of struct pollfd, and this
structure contains the relevant information, including the file
descriptor and what events to watch for. Rather than a timeval, the
timeout is specified as an integer holding the number of milliseconds
(-1 means to wait indefinitely). The following is the poll()
equivalent of our select() example:
#include <poll.h>
#include <limits.h>

struct pollfd fdarray[FOPEN_MAX];
unsigned long nfds = 0;
int timeout = 1000; // 1 second
fdarray[0].fd = sockfd;
fdarray[0].events = POLLIN | POLLOUT | POLLERR;
nfds++;

while (1) {
   int nfd = poll(fdarray, nfds, timeout);
   if ( 0 < nfd ) {
      for ( int i = 0 ; i < nfds ; ++i ) {
         if ( fdarray[i].revents & POLLIN ) { ... }
      }
   } else if ( -1 == nfd ) { ... }
}
FOPEN_MAX is a guaranteed minimum to the number of file descriptors
that a process can open simultaneously. Usually, the actual limit will
be higher than this. struct polldf has three fields, the file
descriptor (fd), a bitmap of flags indicating the events to poll for
(events), and a bitmap of flags indicating what events were detected
(revents). Setting POLLIN is equivalent to putting the file
descriptor in select()’s read set, POLLOUT is the equivalent of
the write set, and POLLERR is the equivalent of the error set.
As with select(), we have to tell poll() how much of the array to
consider. Unlike select(), this only needs to be the actual number
of file descriptors we want to watch, since the array can be densely
packed from the beginning. We can also temporarily disable a file
descriptor by negating the fd field, since negative numbers are
ignored. Another nice feature is that, because the events fields is
unmodified by poll(), we do not have to clear and re-set the entries
for each call. Instead, we just do a bitwise AND for the flags of
interest. As with select(), the return value of poll() is the number
of file descriptors with events returned, or -1 if there is an error.
Additional details
With TCP, you typically have one file descriptor that is listening for
new connections. When it is ready for reading, that means a new
connection has been received, requiring a call to accept(). The
resulting client file descriptor should then be added to read_set or
fdarray, depending on whether you are using select() or poll(). It is important to only attempt to read from or write to a client
socket.
When a client disconnects, with select() you would no longer add its
file descriptor to any of the fd_sets, while for poll() you would
set the fields of its struct pollfd to 0, or just the fd field to
a negative number. These entries in the array can then be reused for
the next new connection.
You should always check to see if a client has disconnected or an error has occurred. Otherwise, you are likely to get strange behavior, and possibly segmentation faults. If you are storing state for clients, make sure you clean this up — free any dynamically allocated memory and make sure that you are no longer looking for socket events from it.
5.2 Data Transfer
In this section, we will explore how to read and write data through sockets, and some ways to format that data.
5.2.1 Reading and Writing
We interact with a socket through a file descriptor, which means the
read() and write() functions will work. There are much better
options, however, which you should use instead, and which we have seen
in our example code.
TCP
To read from a TCP socket, we use the recv() (receive) function; to
write to a socket, we use the send() function. Both of these have
almost identical signatures:
- The first argument is the socket file descriptor.
- The second argument is a buffer, which is an array of bytes.
- The third argument is the number of bytes to receive or send.
- The fourth argument is a bitmap of flags, which will usually be 0.
The return value is the number of bytes received or sent, 0 if the
socket has been closed, or -1 if there was an error (in which case
errno will be set). You should always check the return value, and
not assume that data was received or sent successfully or completely.
Because TCP is a stream protocol, you do not have to receive or send an entire message at once. Instead, you can work with smaller amounts of data. Note that this is considerably less efficient when sending than when receiving. When receiving, you will read as many bytes as requested from the socket’s buffer. When sending, if you write a few bytes, they might be sent immediately, or they might be buffered into a larger packet.
Since the buffer is of type void*, we can provide any pointer to
recv() or send(). These might be char arrays (strings),
unsigned char arrays (essentially byte arrays), pointers to
integers, pointers to structs, etc. We will take a closer look at
some of these options later.
UDP
UDP is a datagram protocol, which means that a message must be contained entirely within a single packet. It is also connectionless, so a single socket can service multiple clients (or servers). That means two things:
- When we read from a UDP socket, we must read the entire packet — any unread data is discarded.
- When we read from or write to a UDP socket, we must include structures containing information about the other end of the connection. When reading, this structure will be filled in for us.
Since recv() and send() do not provide the required fields, we
instead use two new functions: recvfrom() and sendto(). These
functions are very similar to recv() and send(), but they include
a pointer to a socket address and an address length as the fifth and
sixth arguments. In the case of recvfrom(), the address length must
be a pointer, so that we can store the actual length of the
structure. Before calling, it must be the size of the actual structure
(such as a struct sockaddr_in) to which we’re passing a pointer.
5.2.2 Formatting Data
There are many ways to format data. We could use a string-based format (like XML or JSON), a flexible binary format (like ASN.1), or other methods. We are going to do something simpler, however.
Integers and Strings
Say we have an integer, i, and we have defined it as a 4-byte value:
#include <stdint.h>

uint32_t i = 12;
Since a 32-bit integer is stored in memory as four contiguous bytes, we could send this with something like:
int n = send(sockfd,&i,4,0);
Here we have passed a pointer to i as the void* from which
send() will read, and we are sending four bytes from that initial
address. This will work, but it is not quite correct.
The problem is that we have not considered byte-order. To help us
understand what is happening, we will consider a new type that is
defined as a union:
typedef union {
   uint32_t i;
   uint8_t  b[4];
} i32b;
Because this is a union, the fields i and b overlap in
memory. That is, the address of the field i is the same as the
address of the element b[0]. Because the fields have the same
lengths, all of the bytes of i are elements of b, and vice-versa. We now change our code to:
i32b v;
v.i = 12;
n = send(sockfd,&(v.i),4,0);
Say we are on a big-endian system. The uint32_t value 12 corresponds to
v.b[0] = 0;
v.b[1] = 0;
v.b[2] = 0;
v.b[3] = 12;
Now say we are on a little-endian system. That 12 now corresponds to
v.b[0] = 12;
v.b[1] = 0;
v.b[2] = 0;
v.b[3] = 0;
These are very different when sent to a remote host.
How do the hosts know what to send and how to interpret what they receive? They have to agree on some standard. Almost always, this is big-endian, and we refer to big-endian as network byte order. If we expect our code to be portable (which we absolutely should), then we have to convert between network byte order and host byte order:
#include <stdint.h>
#include <sys/types.h>

uint32_t i = htobe32(12);
int n = send(sockfd,&i,4,0);
Here the htobe32() function converts a 32-bit integer in host byte
order to a 32-bit integer in big endian (ie, network) byte order. The reverse of this is be32toh(). These are frequently implemented
as preprocessor macros, rather than actual C functions, so there is no
extra cost to calling them even if your host byte order is already
big endian. In this case, you would have (essentially)
#define htobe32(x) x
We can reverse the process, as well:
#include <stdint.h>
#include <sys/types.h>

uint32_t i;
int n = recv(sockfd,&i,4,0);
if ( 4 == n ) {
   i = be32toh(i);
}
See A General Systems Handbook, Chapter 2, for more details about integer sizes, byte ordering, and byte conversions.
Strings are, in some ways, easier. To send a string, it can be as simple as:
char s[] = "hello";
int n = send(sockfd,s,strlen(s)+1,0);
This will send the string, including the terminal NULL. Receiving
it is more difficult, though, because we do not know how long the
string is. We could speculatively receive bytes until we see a NULL,
or we could send the length first:
char s[] = "hello";
uint8_t len = strlen(s) + 1;
int n = send(sockfd,&len,1,0);
n = send(sockfd,s,len,0);
As long as the string length is less than 255, this will work just fine. On the receiving end:
char s[256];
uint8_t len;
int n = recv(sockfd,&len,1,0);
n = recv(sockfd,s,len,0);
Buffers
As previously mentioned, it can be inefficent to send values one-by-one. We would prefer to fill a buffer, and then send that with one function call. To begin, we need to know how long our buffer must be. Consider the string case. We have some string (a literal here, but it does not need to be), and we want to put the string and its length in a single buffer. Again, assuming the length of the string is less than 255, we could have:
#include <stdlib.h>

unsigned char* buffer;
char s[] = "hello";
uint8_t len = strlen(s) + 1;
buffer = malloc(len+1);
Here len is the length of the string, with 1 added for the
terminating NULL. Our buffer must accommodate not just this length,
but also the additional byte for the length specifier, which is why we
allocate len+1 bytes, or strlen(s)+2.
Now we can fill the buffer using memcpy(), which copies bytes from
one memory location to another:
#include <string.h>

buffer[0] = len;
memcpy(buffer+1,s,len);
int n = send(sockfd,buffer,sizeof(buffer),0);
Since len is a single byte, we can assign it directly to the first
element of buffer. The string s is copied into the buffer starting
at the address of buffer[1].
You can extend this as necessary. Say we have two 4-byte integers and a string to put into our buffer:
uint32_t a = htobe32(1234);
uint32_t b = htobe32(5678);
char s[] = "hello";
uint8_t len = strlen(s) + 1;
unsigned char* buffer = malloc( 4 + 4 + len + 1 );
memcpy(buffer, &a, 4);
memcpy(buffer+4, &b, 4);
buffer[8] = len;
memcpy(buffer+9, s, len);
int n = send(sockfd, buffer, sizeof(buffer), 0);
You will often see an additional pointer used to make this look a little nicer, and to make it easier to rearrange things, if needed:
uint32_t a = htobe32(1234);
uint32_t b = htobe32(5678);
char s[] = "hello";
uint8_t len = strlen(s) + 1;
unsigned char* buffer = malloc( 4 + 4 + len + 1 );
unsigned char* p = buffer;
memcpy(p, &a, 4);   p += 4
memcpy(p, &b, 4);   p += 4;
p[0] = len;         p += 1;
memcpy(p, s, len);  p += len;
int n = send(sockfd, buffer, sizeof(buffer), 0);
We advance our pointer p (initially pointing to the start of buffer) by
the number of bytes written, so that it is always pointing to the next
location where we want to write.
Structures
You might be wondering whether we can just send structures directly, since they are just a collection of fields in memory. We can, but only under certain conditions:
- The fields must not include pointers (nested structures are fine).
- The structure must be packed.
What is a packed structure? Normally, the compiler will add some padding bytes to a complex structure. These bytes are not used, but they cause the fields’ bytes to be aligned in memory in a way that makes accessing them more efficient. This will vary from system to system, however, so we need to ensure that there are no padding bytes in a structure that we send across the network. That is what we mean by a packed structure.
We can define a packed structure with:
struct __attribute__((__packed__)) msg_struct {
   ...
};
This must be done for every structure you are going to use this way, including structures that are included as fields within our message structures. You should be very careful when using this feature, as it is easy to get things wrong. When in doubt, stick to the earlier methods in this section.
5.2.3 Defining Messages
As a stream protocol, there is no mechanism built into TCP to tell us where a message begins or ends. We will look at one fairly simple way to do this in our application, but it is not the only option. Most of the other methods do some variation on this, but with the details abstracted away from the application developer.
We begin by defining a set of message types. These are short fixed-length numbers, often one or two bytes, depending on how many types you need. We start reading data from the socket with this number, and use it to determine how to proceed.
Here is an example:
#define INIT_MSG 0
#define REQ_MSG 1
unsigned char msgType;
int n = recv(sockfd, &msgType, 1, 0);

switch(msgType) {
   case INIT_MSG: ...
   case REQ_MSG: ...
}
Our message type here is a single byte, which can be 0 or 1 (any other value is undefined). We read a single byte from our socket, and then conditionally execute based on the type of message.
From this point, our protocol should specify what fields are in each type of message, in what order, and what sizes they are. We have already seen how to handle values such as integers and strings, but it is worth considering some other types of fields.
We can handle arrays similarly to strings, in that we begin with a length field, and then read that many values in a loop. Note that these values can themselves be complex, with internal message types.
Another option, if our array elements all have the same size, is to
read this amount of data in a loop until we detect an end-of-field
marker. If this marker is not the same size as the data elements, we
can have a linked-list-like structure, where each element contains a
has_next field, or similar.
As long as we specify our messages appropriately, we can use some combination of these techniques to encode and decode anything.
Chapter 6 Traffic
So far, we have looked at how the network is constructed, and how to send messages over that network. Now we will take a look at how we examine traffic in-flight. That is, we will attach processes directly to network interfaces to observe the actual packets (and layer 2 frames). This will include both basic (but powerful) packet capturing tools, as well as filtering tools like firewalls.
6.1 Packet Structure
To start, we need to take a look at the structure of an IPv4 packet:
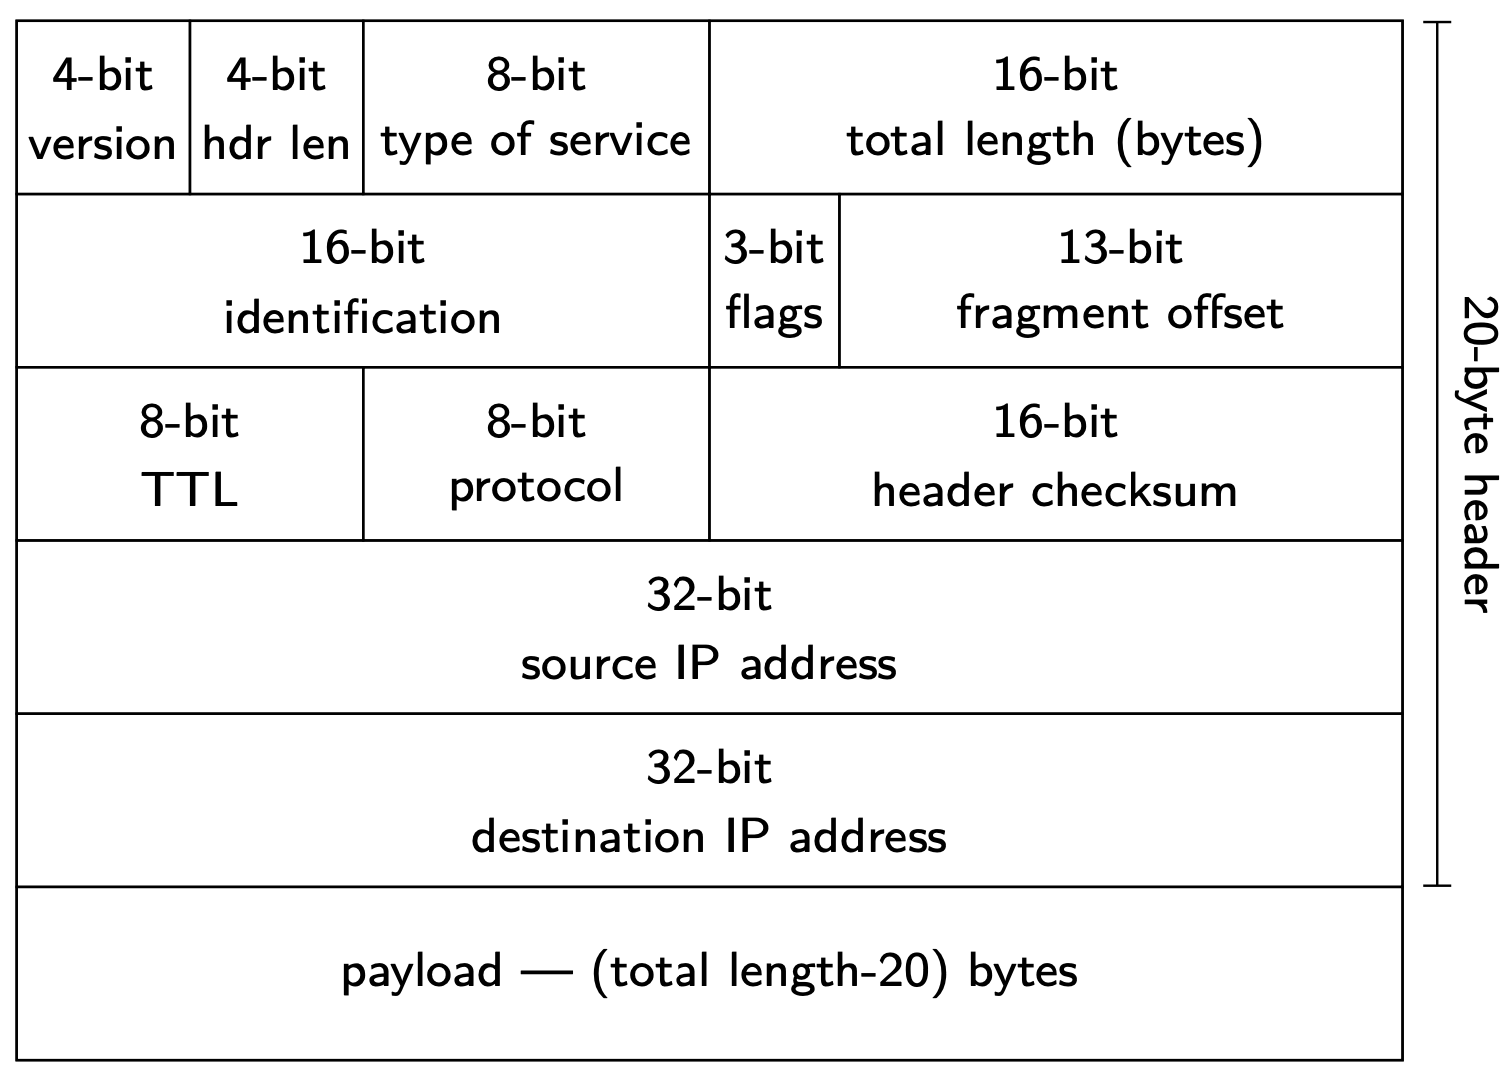
The first byte is divided between a version (which is 4 for IPv4)
and a header length, which is measured in 4-byte words (5 for the
minimal 20-byte header). The next byte is the type of service, which
is often 0, and which we will not worry about. The next two bytes
are the total length of the packet, in bytes, including the header and
payload.
The next four bytes are used to identify and reconstruct packets that might have been fragmented. Fragmentation occurs with the packet’s total length is greater than the path MTU. The two-byte identifier, when combined with the source and destination, uniquely identifies the entire packet. The next two bytes are split between 3 bits of fragmentation flags, and 13 bits for the fragment offset. The flags might indicate that the packet should not be fragmented, or that there are additional fragments following this one. The offset gives the byte offset in the payload for this fragment, but must be multiplied by 8 to obtain the actual offset (because we have used 3 bits for the flags).
The next four bytes are the TTL (1 byte), the layer 4 protocol
specifier (1 byte), and a 2-byte header checksum, which allows
devices to detect errors. Following those are the 4-byte source
address and the 4-byte destination address. If the header length is
greater than 5 (that is, more than 20 bytes), the remainder of the
header are IPv4 options, which we will not cover.
6.2 Packet Capture
There are a number of tools that we can use for packet
capturing. Here, we will focus on tcpdump (the classic), as well as
Wireshark and its associated programs tshark and dumpcap. We will
also look at how we can extend Wireshark and tshark.
Another tool you might want to look at, if you want to go a bit
further, is the scapy package for python. There is a discussion of
this in A General Systems Handbook. There are also other, more
specialized, tools, which you can find in references more focused on
network security.
6.2.1 tcpdump
tcpdump is a widely-available packet capturing utility. A system
with limited capabilities is more likely to have this than the other
tools we will look at, so it is worth exploring in a bit of
detail. Moreover, many of the options used by tcpdump are the same
or very close to options you will see in something like tshark. It is likely that you will need to run tcpdump as the root user.
Despite the name, tcpdump captures all network traffic, not merely
TCP. You can tell it to capture from specific interfaces, filter on
protocols or packet data, and even write to or read from files.
The option you will most often want to specify is -i, which you use
to select an interface to capture. If you do not provide this,
tcpdump will typically connect to the first configured interface,
which may or may not be what you want. To capture on all interfaces,
you would specify -i any (on some systems this might be all).
Another common option is -n, which tells tcpdump not to perform
reverse-lookups to convert numbers to names. That is, the normal
behavior is for tcpdump to take the IP addresses it sees, and
attempt to resolve them to hostnames. This can take a while, so it is
generally faster to add -n to your command, and perform any reverse
lookups you need manually.
The -x option tells tcpdump, which normally only prints header
information, to include the packet contents, in hexadecimal format. If you are looking for specific information from the packets, this can
be very useful. You can limit the amount that will be printed by
setting the snapshot length with the -s option, which takes the
number of bytes as an argument. Related options to -x are -xx
(include the link layer), -X (include ASCII as well as hex), and
-XX (-X, but including the link layer).
The -v option provides more verbose output, and can be specified
multiple times for additional details.
If you are viewing TCP traffic, tcpdump will construct relative
sequence numbers. The sequence numbers are used by TCP to correctly
order data and detect lost packets. They generally start from random
offsets, so relative sequence numbers begin both sides’ counts from
0. If you need to see the actual, absolute sequence numbers, you can
do this with the -S option.
If you want to save the packet capture to a file, you can use the -w
option, which should be followed by a filename. The complement of this
is the -r option, which reads packets from a file rather than
capturing from an interface.
Like many programs, tcpdump will buffer data before printing it to
the screen or writing to a file. You can unbuffer (ie, disable the
buffering) with the -U flag, which is very useful when you want to
be certain that you do not lose any data.
Finally, you can apply a filter to the packets, so that only certain
ones are displayed or written to a file. For example, if you only want
to see ICMP packets, you would add icmp as the filter. If you want
to capture HTTPS traffic, you could add tcp port 443, which will
match the standard HTTPS port as either the source or destination.
Here is an example to capture and display HTTP traffic on the eth0
interface, including packet data (limited to 128 bytes):
$ sudo tcpdump -i eth0 -nx -s 128 tcp port 80
tcpdump: verbose output suppressed, use -v or -vv for full protocol decode
listening on eth0, link-type EN10MB (Ethernet), capture size 128 bytes
19:31:25.623476 IP 172.17.0.2.60522 > 128.8.127.4.80: Flags [S], seq 3656059548, win 64240,
 options [mss 1460,sackOK,TS val 725693382 ecr 0,nop,wscale 7], length 0
	0x0000:  4500 003c a09b 4000 4006 ef00 ac11 0002
	0x0010:  8008 7f04 ec6a 0050 d9eb 0a9c 0000 0000
	0x0020:  a002 faf0 ab4e 0000 0204 05b4 0402 080a
	0x0030:  2b41 33c6 0000 0000 0103 0307
19:31:25.642768 IP 128.8.127.4.80 > 172.17.0.2.60522: Flags [S.], seq 2871939518,
 ack 3656059549, win 65535, options [mss 1460,wscale 2,eol], length 0
	0x0000:  4500 0030 0000 4000 2506 aaa8 8008 7f04
	0x0010:  ac11 0002 0050 ec6a ab2e 51be d9eb 0a9d
	0x0020:  7012 ffff 09bf 0000 0204 05b4 0303 0200
19:31:25.642846 IP 172.17.0.2.60522 > 128.8.127.4.80: Flags [.], ack 1, win 502, length 0
	0x0000:  4500 0028 a09c 4000 4006 ef13 ac11 0002
	0x0010:  8008 7f04 ec6a 0050 d9eb 0a9d ab2e 51bf
	0x0020:  5010 01f6 ab3a 0000
19:31:25.642999 IP 172.17.0.2.60522 > 128.8.127.4.80: Flags [P.], seq 1:142, ack 1, win 502,
 length 141: HTTP: GET / HTTP/1.1
	0x0000:  4500 00b5 a09d 4000 4006 ee85 ac11 0002
	0x0010:  8008 7f04 ec6a 0050 d9eb 0a9d ab2e 51bf
	0x0020:  5018 01f6 abc7 0000 4745 5420 2f20 4854
	0x0030:  5450 2f31 2e31 0d0a 5573 6572 2d41 6765
	0x0040:  6e74 3a20 5767 6574 2f31 2e32 302e 3320
	0x0050:  286c 696e 7578 2d67 6e75 290d 0a41 6363
	0x0060:  6570 743a 202a 2f2a 0d0a 4163 6365 7074
	0x0070:  2d45
19:31:25.643352 IP 128.8.127.4.80 > 172.17.0.2.60522: Flags [.], ack 142, win 65535, length 0
	0x0000:  4500 0028 0000 4000 2506 aab0 8008 7f04
	0x0010:  ac11 0002 0050 ec6a ab2e 51bf d9eb 0b2a
	0x0020:  5010 ffff 35f6 0000
19:31:25.666966 IP 128.8.127.4.80 > 172.17.0.2.60522: Flags [P.], seq 1:592, ack 142,
 win 65535, length 591: HTTP: HTTP/1.1 301 Moved Permanently
	0x0000:  4500 0277 0000 4000 2506 a861 8008 7f04
	0x0010:  ac11 0002 0050 ec6a ab2e 51bf d9eb 0b2a
	0x0020:  5018 ffff a8b8 0000 4854 5450 2f31 2e31
	0x0030:  2033 3031 204d 6f76 6564 2050 6572 6d61
	0x0040:  6e65 6e74 6c79 0d0a 6461 7465 3a20 4672
	0x0050:  692c 2033 3020 4465 6320 3230 3232 2031
	0x0060:  393a 3331 3a32 3520 474d 540d 0a73 6572
	0x0070:  7665
As you can see, tcpdump is able to determine some of the application
information, such as the initial request being a GET /, and the
response a 301 Moved Permanently.
Here are some filter examples:
-
host www.cs.umd.edu: To or fromwww.cs.umd.edu -
src www.cs.umd.edu: Fromwww.cs.umd.edu -
dst www.cs.umd.edu: Towww.cs.umd.edu -
tcp port 443: TCP traffic to or from port 443 (HTTPS) -
tcp src port 443: TCP traffic from port 443 -
greater 100: Packet length greater than 100 bytes -
less 100: Packet length less than 100 bytes -
and/or/not: Boolean operators (parentheses also supported)
The pcap-filter manpage (libpcap is the underlying library that
tcpdump uses) has comprehensive details on the filter language.
6.2.2 Wireshark
Wireshark (wireshark.org) is a graphical packet capture and display
application. It has all of the features of tcpdump, but a friendlier
display. Like tcpdump, it can write packet captures and read them
in. The output format it uses is slightly different, but it is able
to read files produced by tcpdump. This can be very convenient if
you have tcpdump as your only capture option on a system, since you
can write the captured packets to a file, and then transfer that file
to another machine where Wireshark is available.
When you first start Wireshark, it will ask you to select an interface or an existing capture file. The following is from a Mac, but (aside from interface names) it would look similar under Linux or Windows:
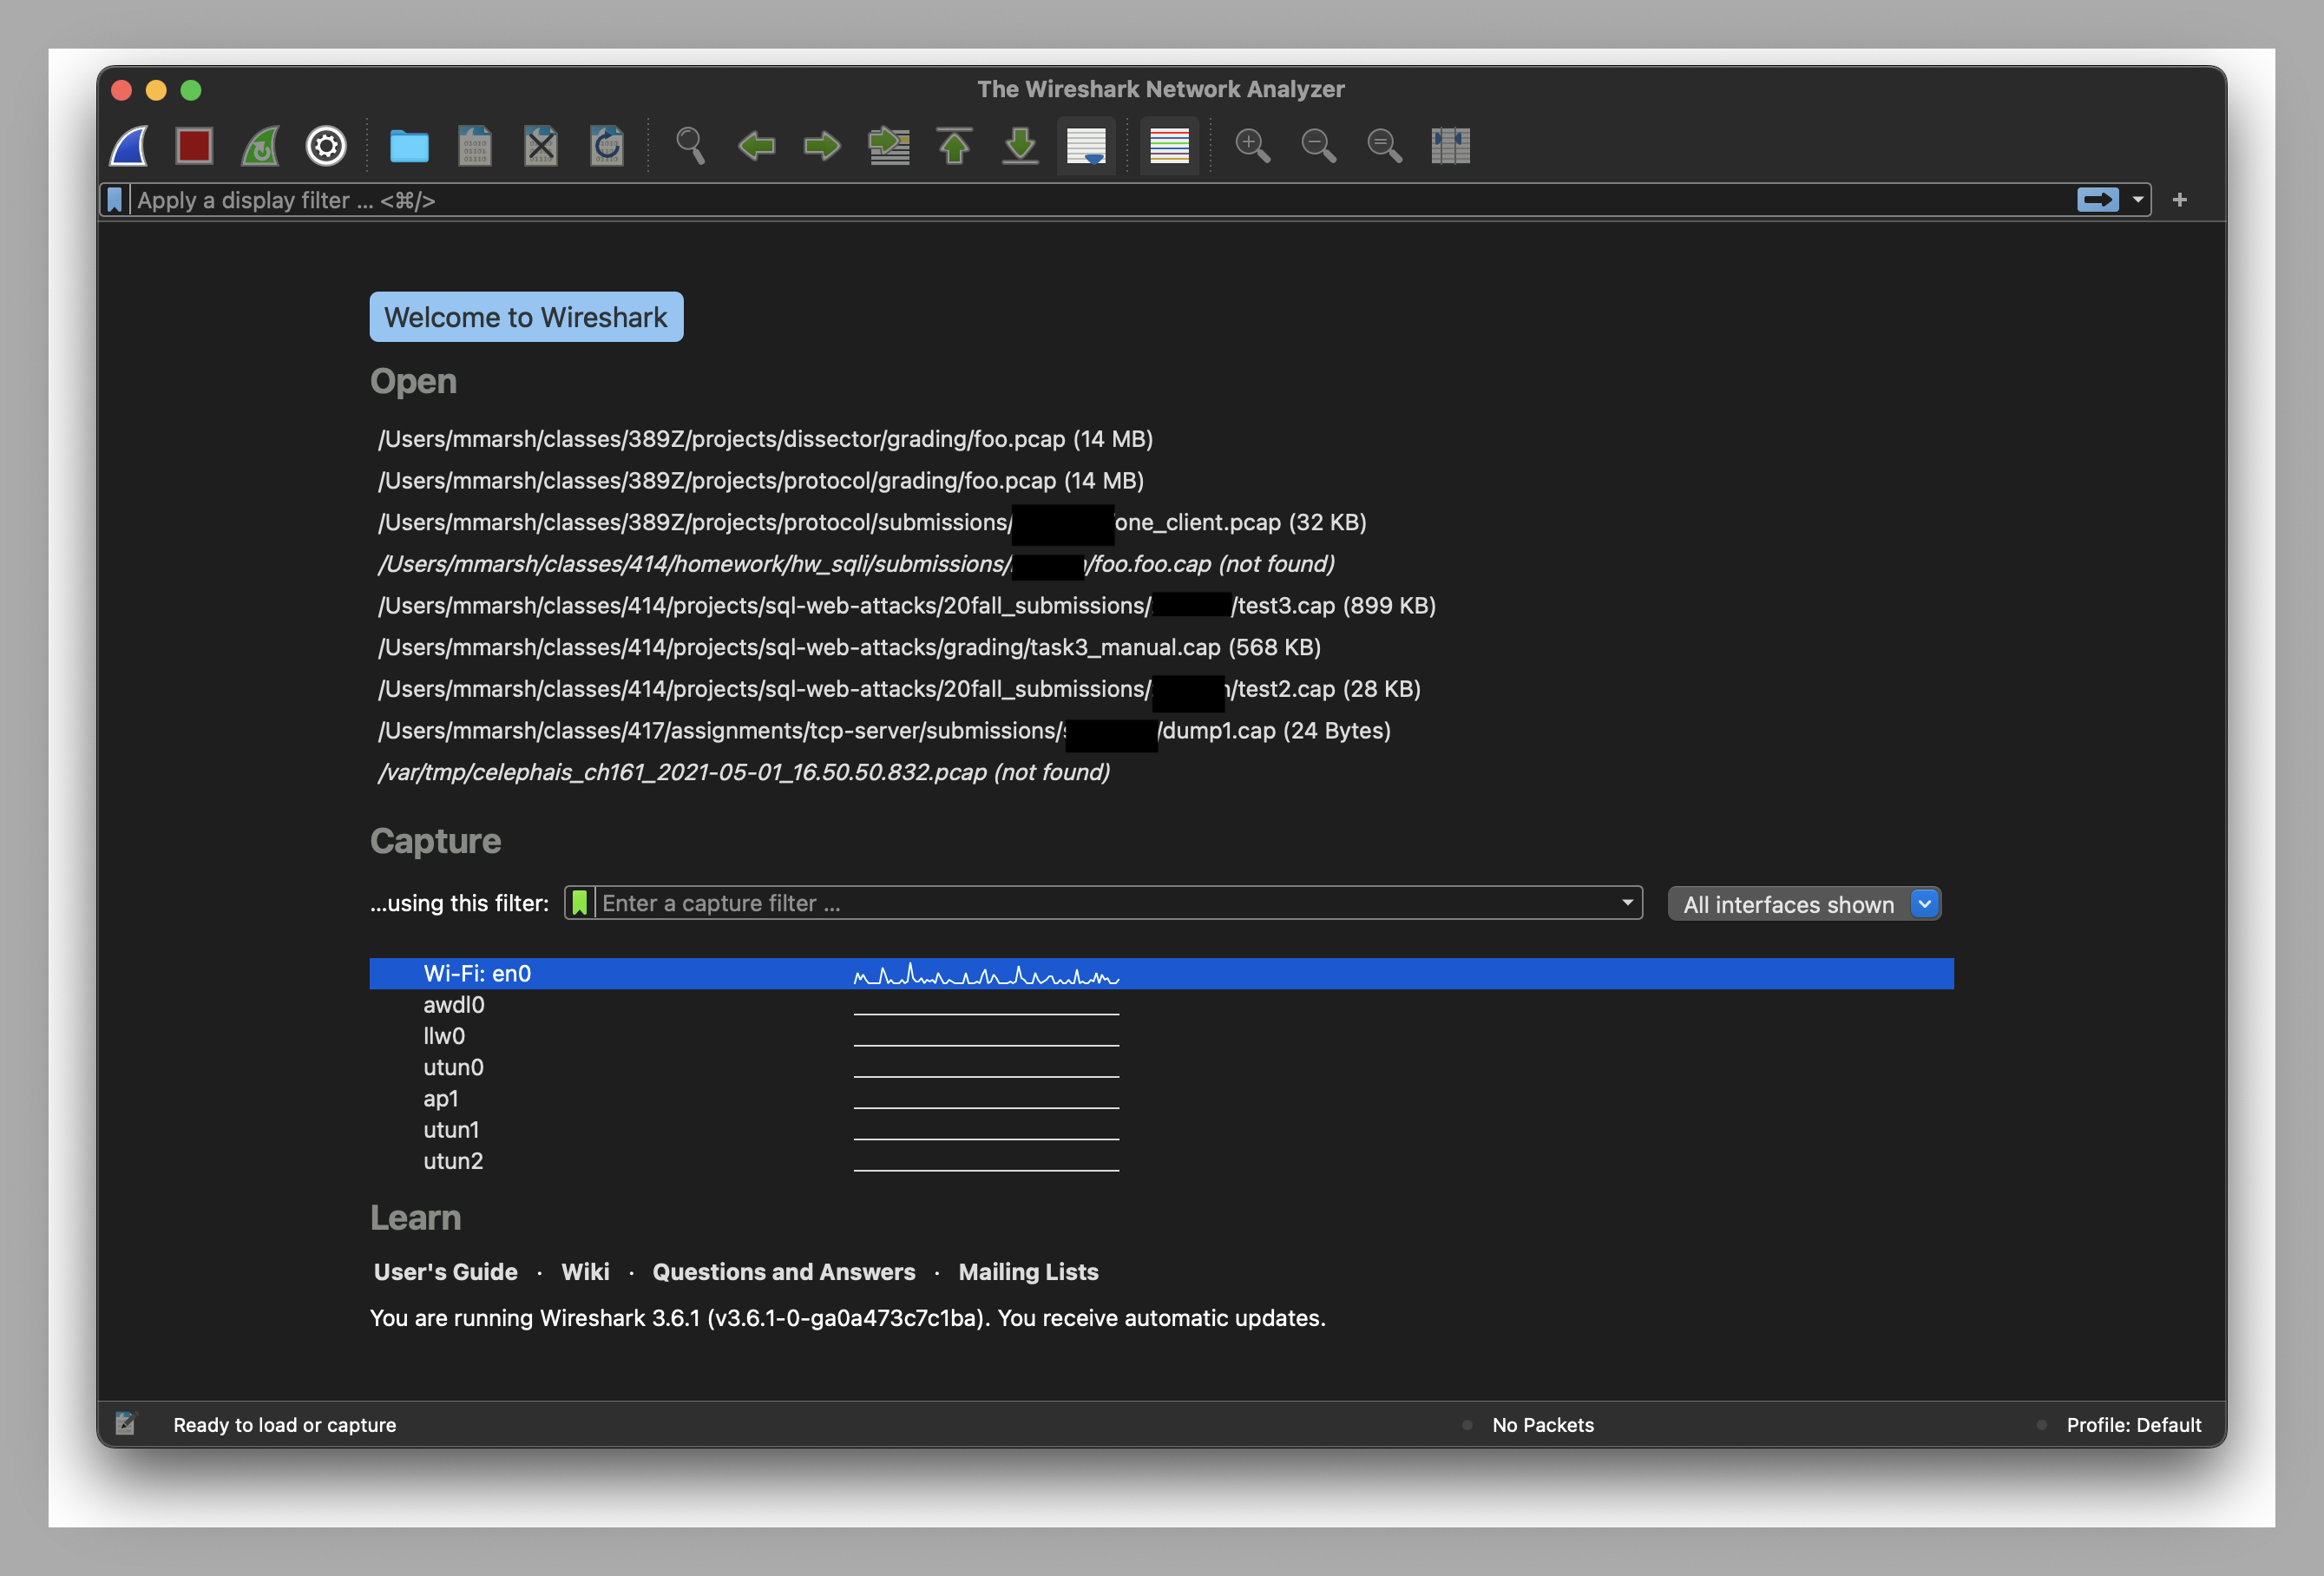
The line diagrams next to the interface names show you the amount of traffic on those interfaces. If we select one of these, we get the following:
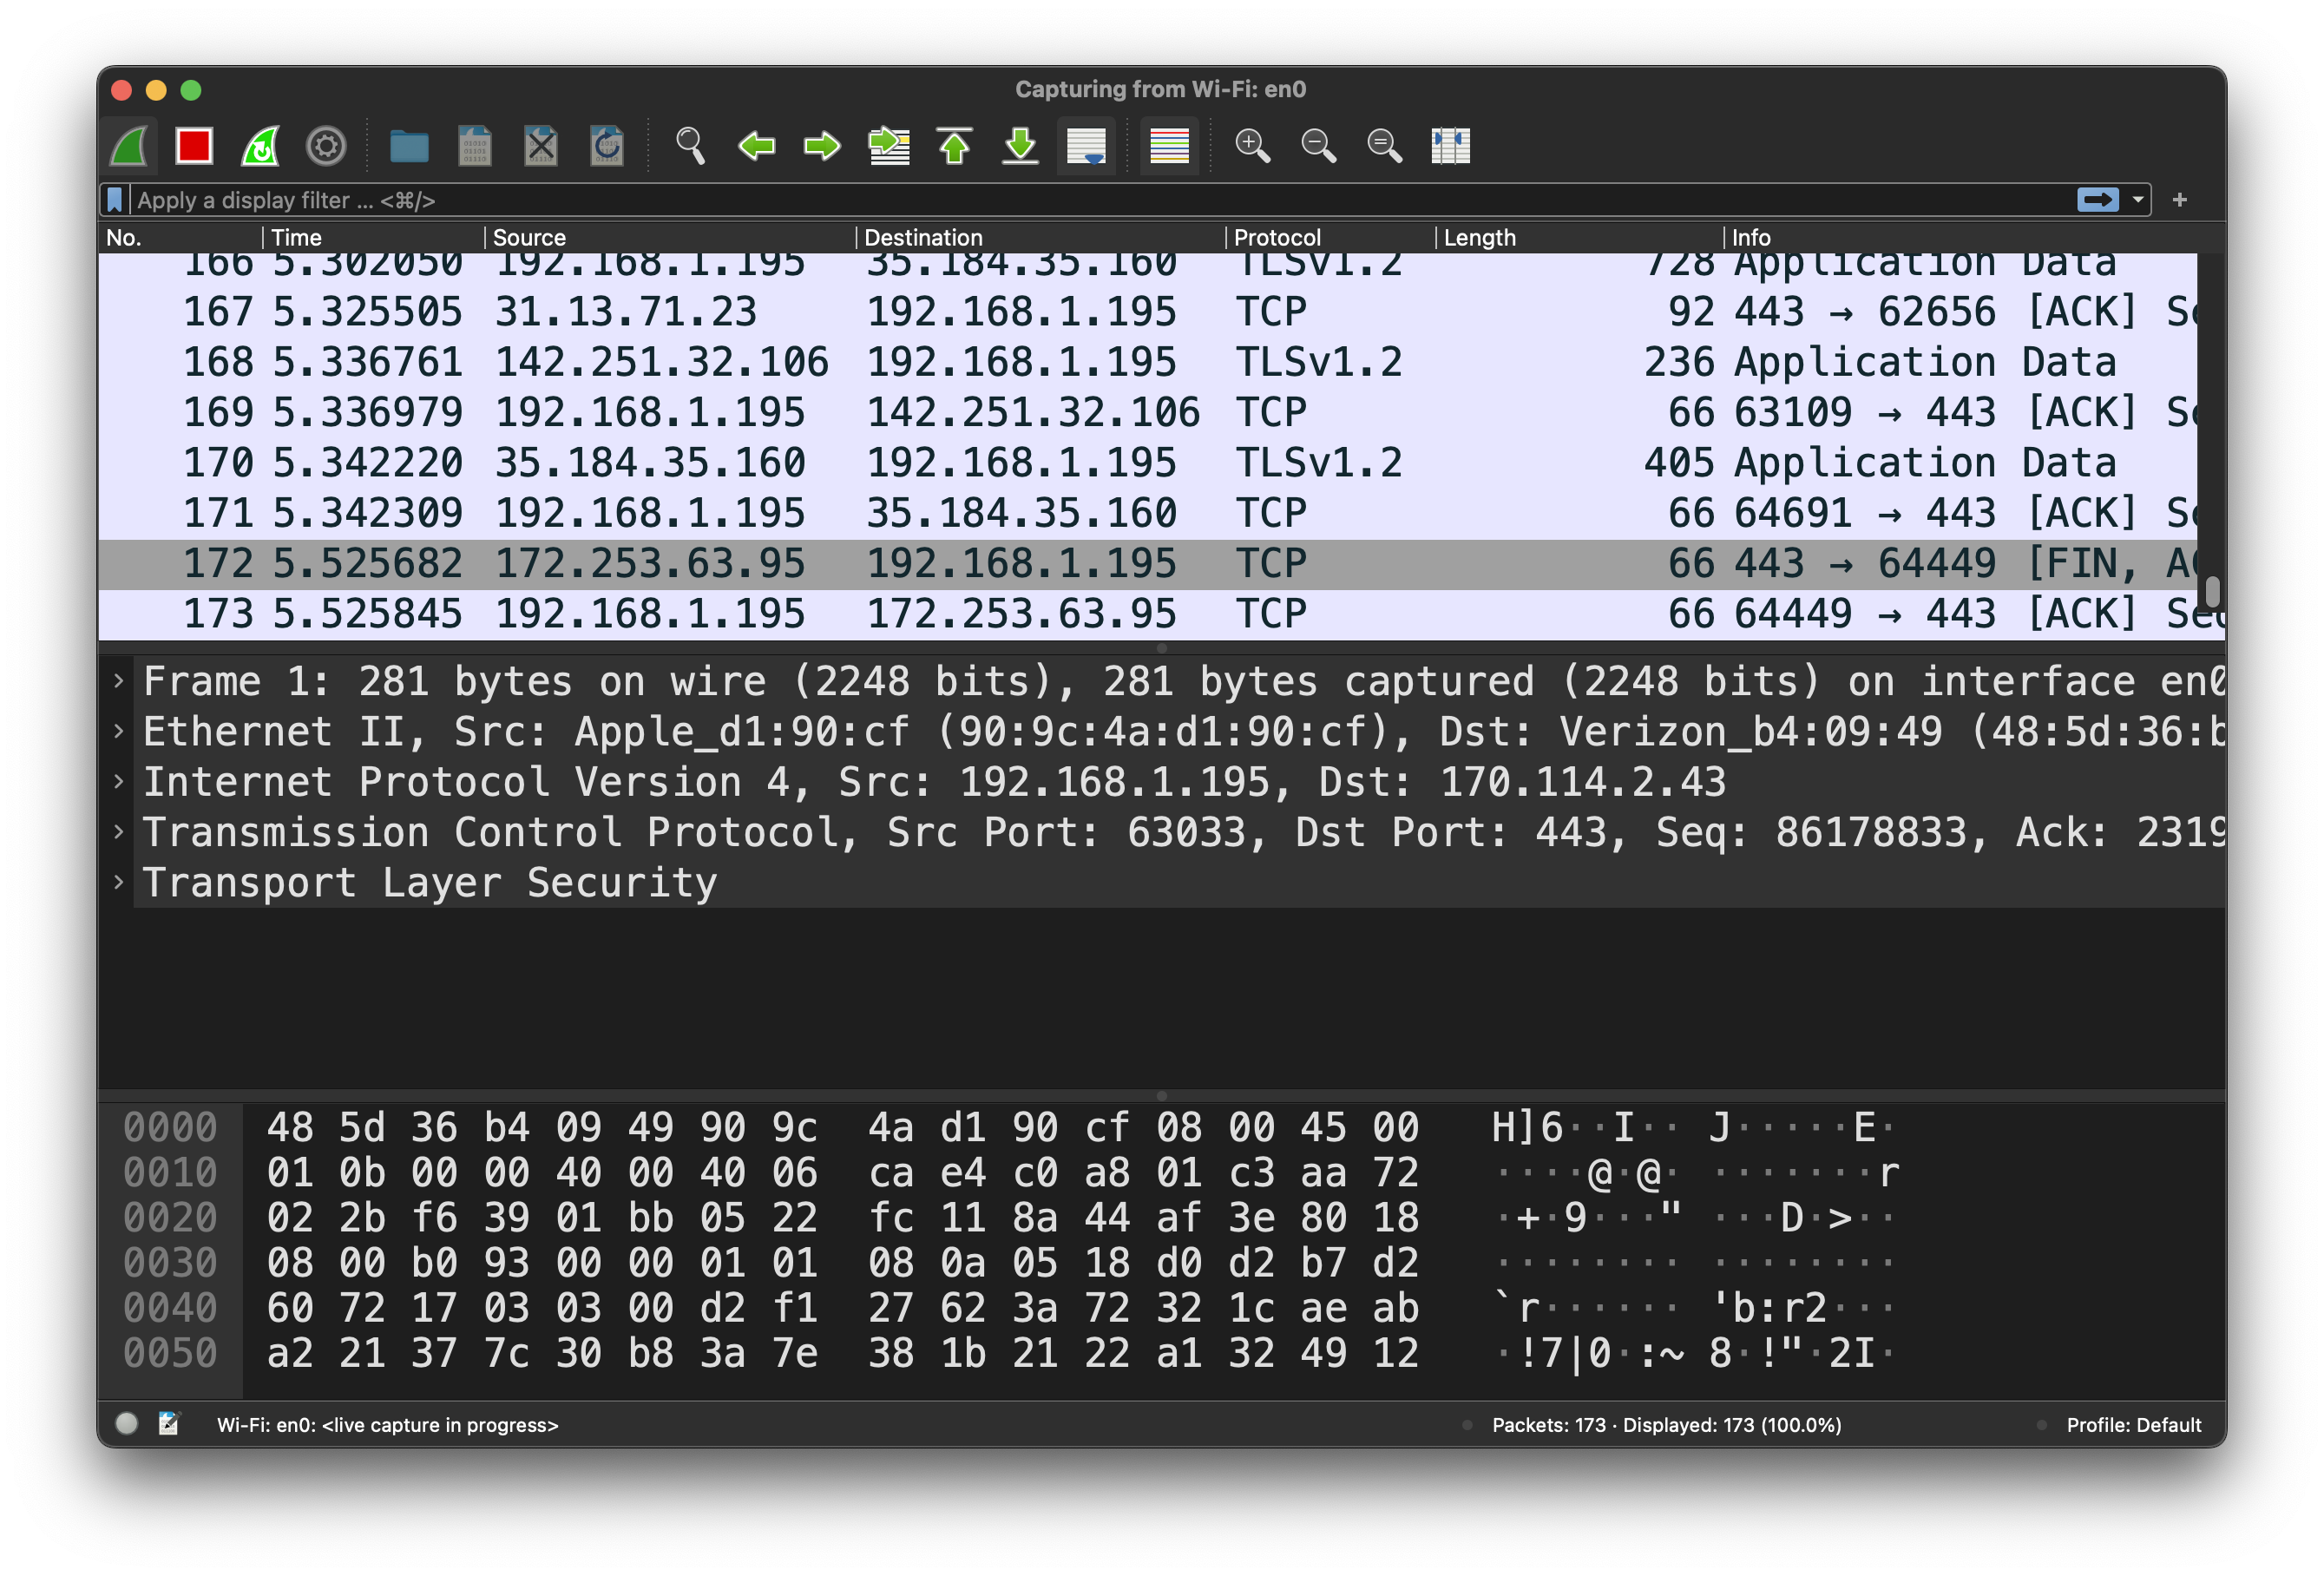
The display is separated into three areas:
- The packet stream
- Details of the selected packet
- Full packet data
The packet stream shows all of the packets that have been captured and match the current filter (if there is one). It shows much of the header information for each packet, making it fairly easy to pick out packets of interest.
When you select one of the packets, the bottom area shows you the
actual bytes, in hexadecimal, and any printable ASCII characters. This
includes the layer 2 frame header, so the actual IPv4 header begins
with the last two bytes of the first line (45 00) at byte 14
(000e).
The middle area shows the packet dissection, where Wireshark has examined the bytes to determine the protocols and their details. We can see details like the source and destination, the fact that it is a TCP packet, and even that at the application layer it is protected with TLS (that is, it is encrypted).
The filter format for Wireshark is very different than that of
tcpdump. If we want to see DNS responses containing more than
one answer, we could specify the filter dns.count.answers > 0,
as shown in Figure 6.4.
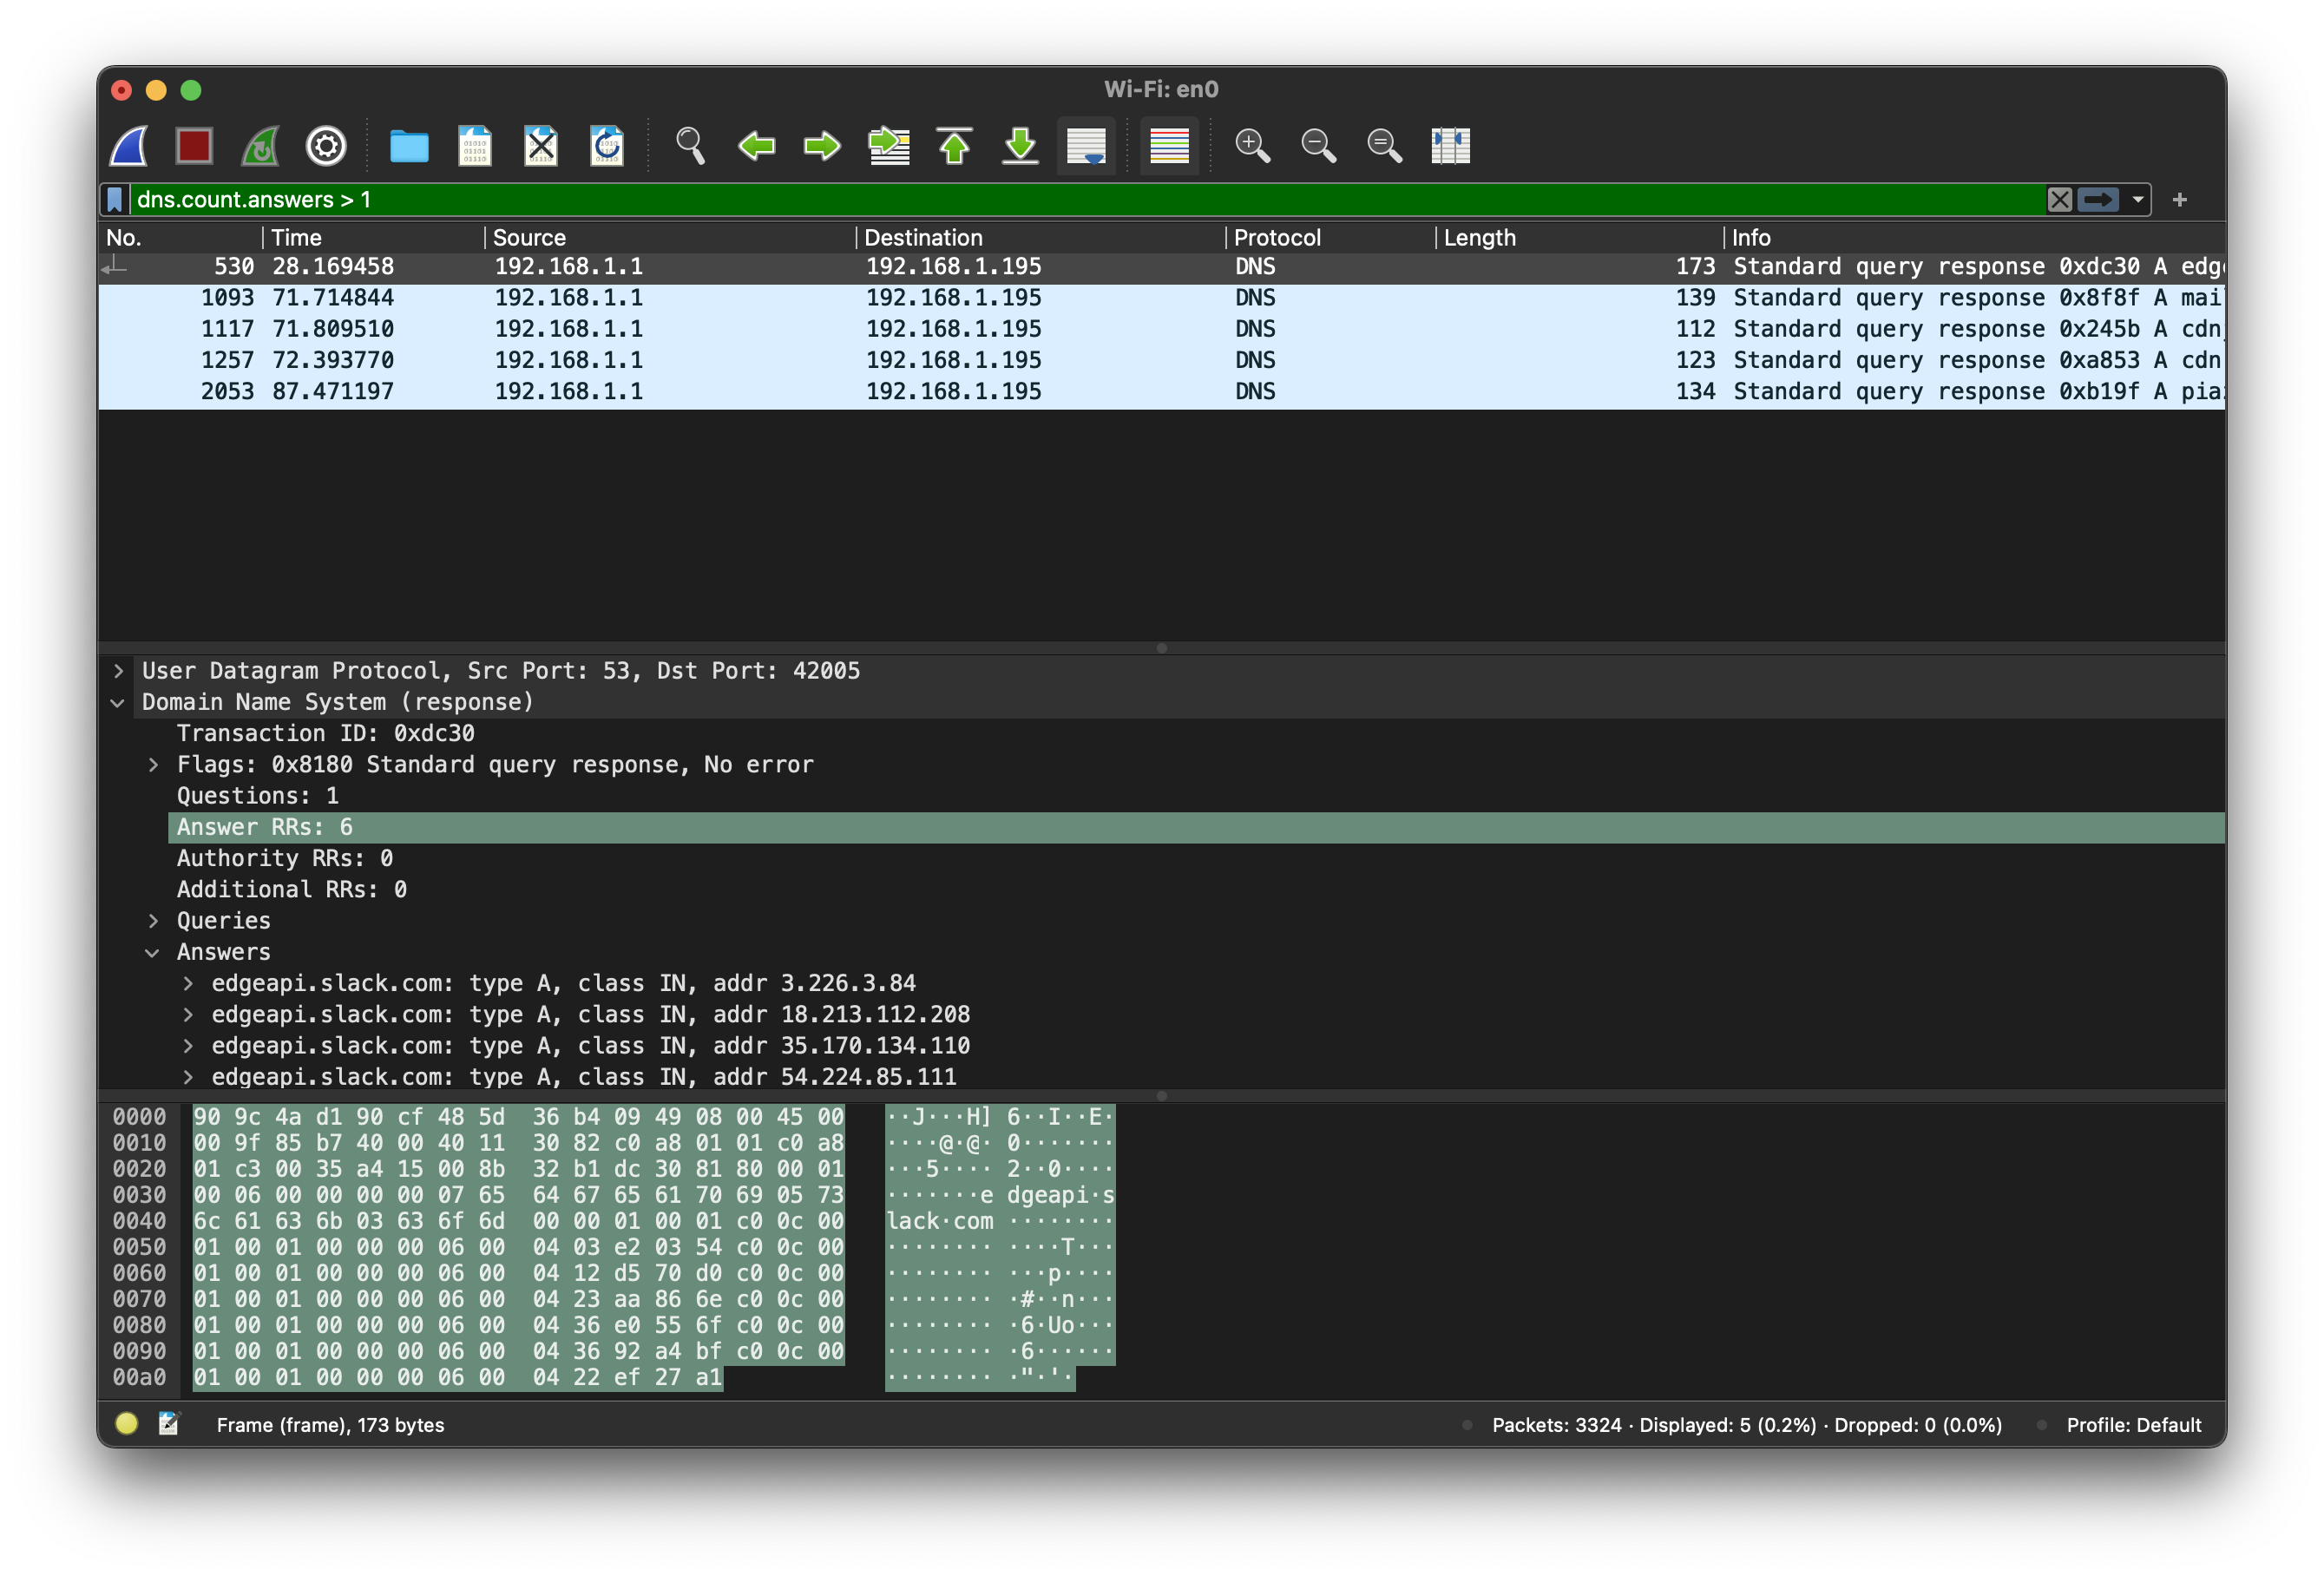
Since DNS is not encrypted, Wireshark is able to display details of the response, including all of the records that were returned. If you select an item from the dissection, Wireshark will highlight the corresponding bytes. The reverse is also true: clicking on a byte will highlight all of the bytes corresponding to its field in the dissection, as well as the dissection item. You can also right-click on something in the dissection or data areas, and save the corresponding data.
6.2.3 tshark and dumpcap
Wireshark comes with two command-line tools, which you might have to
specify when installing it. The first, tshark, is a terminal version
of Wireshark. It can do everything that Wireshark can, just with text
instead of a graphical display. The second, dumpcap, only does
packet capturing, and does not display the packet contents.
By default, tshark produces output somewhat similar to
tcpdump. You can change this with options, however:
-
tshark -Tjson: This produces a JSON string with all of the packets in the capture, including detailed dissections. -
tshark -Tfields: This allows you to specify a set of space-delimited columns containing desired fields. This must be accompanied by at least one-eoption, which specifies fields, such asdataordns.count.answers.
You can also specify stop conditions for tshark and dumpcap. With
the -c option, you can tell the program to exit after capturing a
certain number of packets. More interestingly, you can use the -a
option to specify an autostop condition, such as -a duration:30,
which will automatically stop after 30 seconds.
For both tshark and dumpcap, the -h option gives you detailed
usage information.
6.3 Extending Wireshark
While Wireshark comes with many built-in dissectors, you can write your own. You can also write your own filters, but we will not consider those. Unless you are going to compile your own version of Wireshark, the recommended way to write a dissector is in the lua programming language.
Lua is fairly simple and lightweight, so it has become popular for extensions in a number of applications such as customizable video games. The syntax is not very complex, and if you have programmed in Javascript, a lot of the design principles should look somewhat familiar.
There are two ways to load a dissector into Wireshark or tshark:
- Put the file in the directory
\sim /.local/lib/wireshark/plugins/. If Wireshark is currently running, you will need to select the “Analyze” menu, and then “Reload Lua Plugins”. - When starting the program, add the option
-X lua_script:<filename>, where<filename>should be replaced with the actual filename.
You can find examples at
https://gitlab.com/wireshark/wireshark/-/wikis/Lua/Examples, and
we will base our discussion on fpm.lua (©2015 by Hadriel
Kaplan, released under the 3-clause BSD license). For general
information about lua, see
https://www.lua.org/pil/contents.html.
TCP dissectors are somewhat complicated, because messages might be split between packets, and a single packet might have parts of multiple messages in it. That means we have to maintain state while dissecting packets, and determine whether we have a complete message yet or not.
6.3.1 Lua Syntax Highlights
Before we take a look at the actual code, we should go over a little bit of Lua syntax.
- Single-line comments begin with
–, while block comments are delimited by–[[and]]. -
\sim =is the inequality binary operator (!=in most other languages). - If we have a class
MyClass, we can call a class method (staticin many languages)foowithMyClass.foo. If we have an instancemyClass, we can call an instance methodbarwithmyClass:bar(). - We define a function with the
functionkeyword, and the function definition ends with theendkeyword. Thereturnkeyword specifies the value to return. - By default, variables and functions are created in the global namespace. You can prepend them with the
localkeyword to keep them in the local scope instead. - Loops have the form
for x in list do ... endorfor i = start,end,step do ... end. - We also have
whileloops andif-elseif-elseblocks, similarly defined (that is,doto begin the body of the block andendto end it).
6.3.2 Creating a Protocol and Defining Fields
fpm.lua has a lot of comments, which are worth reading for details
on why the dissector is written the way it is. It also has some
features we will not bother with, such as configuration and debugging
with different verbosity levels.
The actual dissector code begins with
--------------------------------------------------------------------------------
-- creates a Proto object, but doesn't register it yet
local fpm_proto = Proto("fpm", "FPM Header")
This defines a new Proto object. The protocol dissection will be
nested under this, so all fields will begin with fpm, the first
argument. Compare this with the filter dns.count.answers > 0, where
dns is the top-level value. The second argument is the verbose name
for the protocol. Again comparing with DNS, this is the equivalent of
“Domain Name System” in the packet details.
The next thing in the file is a helper function
----------------------------------------
-- a function to convert tables of enumerated types to value-string tables
-- i.e., from { "name" = number } to { number = "name" }
local function makeValString(enumTable)
    local t = {}
    for name,num in pairs(enumTable) do
        t[num] = name
    end
    return t
end
Given a mapping \( A \mapsto B \), this creates the inverse mapping \( B \mapsto A \). We use this in
local msgtype = {
    NONE     = 0,
    NETLINK  = 1,
}
local msgtype_valstr = makeValString(msgtype)
Here we have defined an enumeration msgtype that assigns a protocol
value (0 or 1) to a name (NONE or NETLINK), and then creates
the reverse msgtype_valstr. This means that when we extract a
message type from a packet, we can use msgtype_valstr to recover
the name.
The FPM protcol has three header fields, and these are what we define next.
----------------------------------------
-- a table of all of our Protocol's fields
local hdr_fields =
{
    version   = ProtoField.uint8 ("fpm.version", "Version", base.DEC),
    msg_type  = ProtoField.uint8 ("fpm.type", "Type", base.DEC, msgtype_valstr),
    msg_len   = ProtoField.uint16("fpm.length", "Length", base.DEC),
}

-- register the ProtoFields
fpm_proto.fields = hdr_fields
The last line sets this mapping as the protocol’s fields. For each
field, we use a class method to construct an explicitly sized object,
with the field name (eg, fpm.type), the text to display for the
field (eg, “Type”), the format for the field (eg, base.DEC for
decimal), and optionally a mapping to display a text field
corresponding to the numeric value (eg, msgtype_valstr).
Next we define the header length (which is constant in this case) and provide forward declarations for helper functions.
-- this is the size of the FPM message header (4 bytes) and the minimum FPM
-- message size we need to figure out how much the rest of the Netlink message
-- will be
local FPM_MSG_HDR_LEN = 4

-- some forward "declarations" of helper functions we use in the dissector
local createSllTvb, dissectFPM, checkFpmLength
If we have a variable header length (like the IPv4 header), then we would want a minimum length.
6.3.3 The Dissector
Now we come to the actual dissector, which is somewhat long. We have
omitted the definition of tvbs and dprint2. The comments are very
descriptive, so we will just note that we have to look at all of the
data in the packet, because there might be multiple messages or
partial messages. The return value at the end of this should either be
the total number of bytes consumed by the dissector (that is, we have
converted these bytes into one or more complete messages) or \( -1 \)
times the number of bytes we need to complete the partial message at
the end of the packet. Some of the work has been pushed to the
dissectFPM helper function, which we will look at after this
function.
--------------------------------------------------------------------------------
-- The following creates the callback function for the dissector.
-- It's the same as doing "fpm_proto.dissector = function (tvbuf,pkt,root)"
-- The 'tvbuf' is a Tvb object, 'pktinfo' is a Pinfo object, and 'root' is a TreeItem object.
-- Whenever Wireshark dissects a packet that our Proto is hooked into, it will call
-- this function and pass it these arguments for the packet it's dissecting.
function fpm_proto.dissector(tvbuf, pktinfo, root)
    dprint2("fpm_proto.dissector called")
    -- reset the save Tvbs
    tvbs = {}

    -- get the length of the packet buffer (Tvb).
    local pktlen = tvbuf:len()

    local bytes_consumed = 0

    -- we do this in a while loop, because there could be multiple FPM messages
    -- inside a single TCP segment, and thus in the same tvbuf - but our
    -- fpm_proto.dissector() will only be called once per TCP segment, so we
    -- need to do this loop to dissect each FPM message in it
    while bytes_consumed < pktlen do

        -- We're going to call our "dissect()" function, which is defined
        -- later in this script file. The dissect() function returns the
        -- length of the FPM message it dissected as a positive number, or if
        -- it's a negative number then it's the number of additional bytes it
        -- needs if the Tvb doesn't have them all. If it returns a 0, it's a
        -- dissection error.
        local result = dissectFPM(tvbuf, pktinfo, root, bytes_consumed)

        if result > 0 then
            -- we successfully processed an FPM message, of 'result' length
            bytes_consumed = bytes_consumed + result
            -- go again on another while loop
        elseif result == 0 then
            -- If the result is 0, then it means we hit an error of some kind,
            -- so return 0. Returning 0 tells Wireshark this packet is not for
            -- us, and it will try heuristic dissectors or the plain "data"
            -- one, which is what should happen in this case.
            return 0
        else
            -- we need more bytes, so set the desegment_offset to what we
            -- already consumed, and the desegment_len to how many more
            -- are needed
            pktinfo.desegment_offset = bytes_consumed

            -- invert the negative result so it's a positive number
            result = -result

            pktinfo.desegment_len = result

            -- even though we need more bytes, this packet is for us, so we
            -- tell wireshark all of its bytes are for us by returning the
            -- number of Tvb bytes we "successfully processed", namely the
            -- length of the Tvb
            return pktlen
        end
    end

    -- In a TCP dissector, you can either return nothing, or return the number of
    -- bytes of the tvbuf that belong to this protocol, which is what we do here.
    -- Do NOT return the number 0, or else Wireshark will interpret that to mean
    -- this packet did not belong to your protocol, and will try to dissect it
    -- with other protocol dissectors (such as heuristic ones)
    return bytes_consumed
end
6.3.4 Dissecting the Bytes
Most of the real work is being done in the following helper function. It will start by checking the number of bytes we have received so far,
and see whether we have a complete message. The while loop in the
dissector ensures we are only dealing with a single protocol message
here. If we do not have enough data yet, we return \( -1 \) times the
number of bytes still to come, as returned by checkFpmLength. If we
have a complete message, we pull apart the bytes within it and build
up the protocol’s dissection tree. All that you really need to know
about the Tvb type is that it has a range instance method that
takes an offset and number of bytes and returns a TvbRange, and that
TvbRange can be converted to useable types with its instance methods
like uint. The TvbRange is what you add to the tree for a given
field. This particular protocol has internal data that can either be
parsed as the NetLink protocol or the generic Data protocol.
----------------------------------------
-- The following is a local function used for dissecting our FPM messages
-- inside the TCP segment using the desegment_offset/desegment_len method.
-- It's a separate function because we run over TCP and thus might need to
-- parse multiple messages in a single segment/packet. So we invoke this
-- function only dissects one FPM message and we invoke it in a while loop
-- from the Proto's main disector function.
--
-- This function is passed in the original Tvb, Pinfo, and TreeItem from the Proto's
-- dissector function, as well as the offset in the Tvb that this function should
-- start dissecting from.
--
-- This function returns the length of the FPM message it dissected as a
-- positive number, or as a negative number the number of additional bytes it
-- needs if the Tvb doesn't have them all, or a 0 for error.
--
dissectFPM = function (tvbuf, pktinfo, root, offset)
    dprint2("FPM dissect function called")

    local length_val, length_tvbr = checkFpmLength(tvbuf, offset)

    if length_val <= 0 then
        return length_val
    end

    -- if we got here, then we have a whole message in the Tvb buffer
    -- so let's finish dissecting it...

    -- set the protocol column to show our protocol name
    pktinfo.cols.protocol:set("FPM")

    -- set the INFO column too, but only if we haven't already set it before
    -- for this frame/packet, because this function can be called multiple
    -- times per packet/Tvb
    if string.find(tostring(pktinfo.cols.info), "^FPM") == nil then
        pktinfo.cols.info:set("FPM")
    end

    -- We start by adding our protocol to the dissection display tree.
    local tree = root:add(fpm_proto, tvbuf:range(offset, length_val))

    -- dissect the version field
    local version_tvbr = tvbuf:range(offset, 1)
    local version_val  = version_tvbr:uint()
    tree:add(hdr_fields.version, version_tvbr)

    -- dissect the type field
    local msgtype_tvbr = tvbuf:range(offset + 1, 1)
    local msgtype_val  = msgtype_tvbr:uint()
    tree:add(hdr_fields.msg_type, msgtype_tvbr)

    -- dissect the length field
    tree:add(hdr_fields.msg_len, length_tvbr)

    -- ok now the hard part - try calling a sub-dissector?
    -- only if settings/prefs told us to of course...
    if default_settings.subdissect and (version_val == 1) and (msgtype_val == msgtype.NETLINK) then
        -- append the INFO column - this will be overwritten/replaced by the
        -- Netlink dissector, which sadly appears to clear it but not set
        -- anything, so doing this is kind of silly/pointless, but since this
        -- is a tutorial script, this showswhat you might want to do for your
        -- protocol
        if string.find(tostring(pktinfo.cols.info), "^FPM:") == nil then
            pktinfo.cols.info:append(": Netlink")
        else
            pktinfo.cols.info:append(", Netlink")
        end

        -- it carries a Netlink message, so we're going to create a new Tvb
        -- with a a fake Linux SLL header for the built-in Netlink dissector
        -- to use
        local tvb = createSllTvb(tvbuf, offset + FPM_MSG_HDR_LEN, length_val - FPM_MSG_HDR_LEN)

        dprint2("FPM trying sub-dissector for wtap encap type:", default_settings.subdiss_type)

        -- invoke the Netlink dissector (we got the Dissector object earlier,
        -- as variable 'netlink')
        netlink:call(tvb, pktinfo, root)

        dprint2("FPM finished with sub-dissector")
    else
        dprint2("Netlink sub-dissection disabled or not Netlink type, invoking 'data' dissector")
        -- append the INFO column
        if string.find(tostring(pktinfo.cols.info), "^FPM:") == nil then
            pktinfo.cols.info:append(": Unknown")
        else
            pktinfo.cols.info:append(", Unknown")
        end

        tvbs[#tvbs+1] = tvbuf(offset + FPM_MSG_HDR_LEN, length_val - FPM_MSG_HDR_LEN):tvb()
        data:call(tvbs[#tvbs], pktinfo, root)
    end

    return length_val
end
6.3.5 Determining the Length of a Message
Now we look at the function to determine whether we have a complete
message. If all protocol messages are not the same length, this will
have to do some parsing without actually consuming bytes. It returns a
pair of values. The first element the length of the message, \( -1 \)
times the number of bytes still needed, or 0 if there was an error. If
we have not yet received enough bytes to determine the actual message
length, we instead return -DESEGMENT_ONE_MORE_SEGMENT. The second
element is the TvbRange object containing the message, or nil if
we do not yet have a complete message.
----------------------------------------
-- The function to check the length field.
--
-- This returns two things: (1) the length, and (2) the TvbRange object, which
-- might be nil if length <= 0.
checkFpmLength = function (tvbuf, offset)

    -- "msglen" is the number of bytes remaining in the Tvb buffer which we
    -- have available to dissect in this run
    local msglen = tvbuf:len() - offset

    -- check if capture was only capturing partial packet size
    if msglen ~= tvbuf:reported_length_remaining(offset) then
        -- captured packets are being sliced/cut-off, so don't try to desegment/reassemble
        dprint2("Captured packet was shorter than original, can't reassemble")
        return 0
    end

    if msglen < FPM_MSG_HDR_LEN then
        -- we need more bytes, so tell the main dissector function that we
        -- didn't dissect anything, and we need an unknown number of more
        -- bytes (which is what "DESEGMENT_ONE_MORE_SEGMENT" is used for)
        dprint2("Need more bytes to figure out FPM length field")
        -- return as a negative number
        return -DESEGMENT_ONE_MORE_SEGMENT
    end

    -- if we got here, then we know we have enough bytes in the Tvb buffer
    -- to at least figure out the full length of this FPM messsage (the length
    -- is the 16-bit integer in third and fourth bytes)

    -- get the TvbRange of bytes 3+4
    local length_tvbr = tvbuf:range(offset + 2, 2)

    -- get the length as an unsigned integer, in network-order (big endian)
    local length_val  = length_tvbr:uint()

    if length_val > default_settings.max_msg_len then
        -- too many bytes, invalid message
        dprint("FPM message length is too long: ", length_val)
        return 0
    end

    if msglen < length_val then
        -- we need more bytes to get the whole FPM message
        dprint2("Need more bytes to desegment full FPM")
        return -(length_val - msglen)
    end

    return length_val, length_tvbr
end
6.3.6 Adding the Dissector to Wireshark
The last thing we need to do is add our dissector to Wireshark’s table
of dissectors. We get the appropriate table for mapping TCP ports to
dissectors with DissectorTable.get("tcp.port"), and then call the
instance method add with the port to use and the Proto object.
--------------------------------------------------------------------------------
-- We want to have our protocol dissection invoked for a specific TCP port,
-- so get the TCP dissector table and add our protocol to it.
local function enableDissector()
    -- using DissectorTable:set() removes existing dissector(s), whereas the
    -- DissectorTable:add() one adds ours before any existing ones, but
    -- leaves the other ones alone, which is better
    DissectorTable.get("tcp.port"):add(default_settings.port, fpm_proto)
end
-- call it now, because we're enabled by default
enableDissector()

local function disableDissector()
    DissectorTable.get("tcp.port"):remove(default_settings.port, fpm_proto)
end
6.4 Firewalls
Linux generally comes with a firewall package called iptables. This
can actually do more than just filter out traffic that might be
harmful. It can also be used to create a network address translator
(NAT) or set quality of service (QoS) bits in a packet.
iptables has four default tables:
-
filterdoes packet filtering, which is what you would typically think of as firewall behavior -
natprovides network address translation -
manglemodifies packets, typically for quality of service -
rawis used for anything that does not fit elsewhere
When you want to operate on a specific table (the default is filter),
you can specify the table with the -t option.
Each table contains a set of chains, and each chain contains a list of rules. At different stages of processing a packet, different chains will be invoked. For a particular chain, the rules are checked in order until one matches. The standard chains are
-
PREROUTING: This is applied to packets before routing. That is, before the host consults the routing table for the next hop. This chain exists in thenat,mangle, andrawtables. -
INPUT: This is applied to packets with this host as the destination. It exists in thefilter,nat, andmangletables. -
FORWARD: If the current host is neither the source nor destination (that is, it is forwarding the packet), this chain is applied. It exists in thefilterandmangletables. -
OUTPUT: This is applied to packets originating at this host. It exists in all tables. -
POSTROUTING: This is applies after the outgoing interface has been determined by the routing table, but before the packet is passed to that interface. It exists in thenatandmangletables.
Here is a summary table:
| Chain | filter |
nat |
mangle |
raw |
PREROUTING |
no | yes | yes | yes |
INPUT |
yes | yes | yes | no |
FORWARD |
yes | no | yes | no |
OUTPUT |
yes | yes | yes | yes |
POSTROUTING |
no | yes | yes | no |
You can view a chain with the –list option. You can also define
your own chains with -N (new chain). As noted previously, the chains
are ordered lists of rules. Each rule has a condition and a
target. The first rule whose condition is met by the packet is
applied, and the rest are ignored. Chains will have a default policy,
usually with a target of ACCEPT or DROP, for any packets that do
not match another rule. This can be set with the -P option, which
takes the chain and target as options. The most common filter targets
are:
-
ACCEPT: The packet passes through the chain. -
DROP: The packet is silently dropped. -
REJECT: The packet is dropped, and an error message is returned.
There are many other targets, which are documented in https://www.frozentux.net/iptables-tutorial/iptables-tutorial.htmlTARGETS. Some of these allow you to modify the packet, such as changing addresses, ports, or protocol options.
To append a new rule to a chain, you use the -A option. To replace a
rule, you use the -R option. To insert a rule (moving the rest
down), you use the -I option. To delete a rule, you use the -D
option. Except for appending, you need to specify the index at which
the operation should be applied. These begin at 1. The general format
for these operations is, after the initial option, the chain, the
index (where appropriate), the conditions, and the target (specified
with the -j option).
Here are some examples (all operating on the filter table):
iptables -A INPUT -p tcp --dport 1234 -j ACCEPT
This appends a rule to the INPUT chain, with the TCP protocol and a
destination port of 1234. These packets should be accepted.
iptables -R INPUT 1 -p tcp --dport 4321 -j ACCEPT
Assuming we began with an empty chain, this replaces the rule above
with the same rule, but the destination port changed to 4321. The
original rule is no longer present.
iptables -I INPUT 1 -p udp --dport 1234 -j ACCEPT
This inserts a new rule before the one we created, specifying that UDP
packets with a destination port of 1234 should be accepted.
iptables -D INPUT 2
This removes the TCP rule, leaving only the UDP rule.