Treemap Art Project Begins August 27

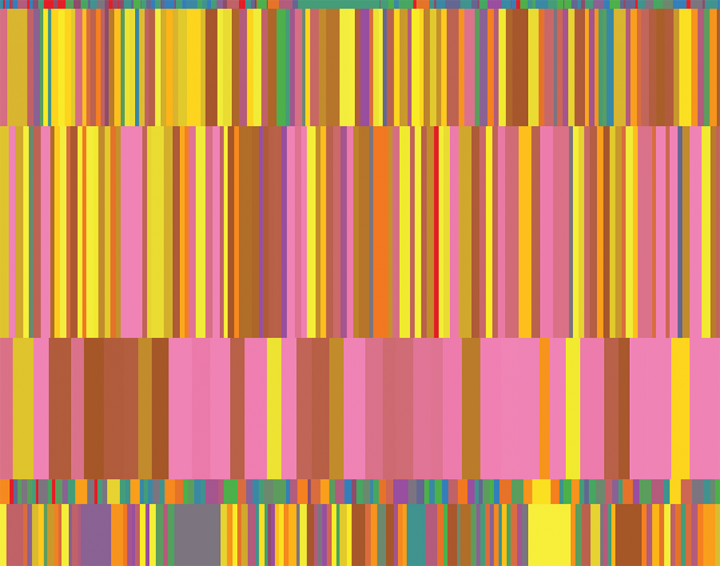
This visualization shows statistics about certain TED talks. The dataset was compiled by Sebastian Wernicke for his TED talk on Lies, damned lies and statistics. Each of the boxes represents the engagement score for a certain TED talk. The colors depend on the total number of del.icio.us bookmarks for that certain TED talk. The coloring was done in 8 equally dense bins with pink being highest and red being lowest. The colors here try to capture the variety and charismatic excellence of the TED talks.
Treemaps is a popular visualization tool developed in the Department's Human-Computer Interaction Lab. While originally conceived to map functional things like hard drives, the tool often produces aesthetically pleasing results. The Treemap Art Project, curated by Prof. Ben Shneiderman, aims to highlight visualization's artistic side with a collection of framed prints that will be displayed on the 3rd floor of CSIC.
For more information: http://treemapart.wordpress.com
The Department welcomes comments, suggestions and corrections. Send email to editor [-at-] cs [dot] umd [dot] edu.