Zoomable Graphical Sketchpad
In an effort to understand multiscale spaces better, we have developed an analytical tool for describing them which we call space-scale diagrams. By representing the spatial structure of an information world at all its different magnifications simultaneously, these diagrams allow us to visualize various aspects of zoomable interfaces and analyze their properties. We discuss these diagrams briefly here. They are discussed in more detail in [17].
While Pad++ provides panning and zooming interactions over a two dimensional surface, the basic ideas of a space-scale diagram are most easily illustrated in one dimension. This would typically be a slice through a two-dimensional world.
The basic one-dimensional diagram concept is illustrated in Figure 9. This diagram shows six points that are copied over and over at all possible magnifications. These copies are stacked up systematically to create a two dimensional diagram whose horizontal axes represents the original spatial dimension and whose vertical axis represents the degree of magnification (or scale). Because the diagram shows an infinite number of magnifications, each point is represented by a line emanating from the origin. We call these lines great rays. In the 2-D analog, whole 2D pictures would be stacked up at all magnifications, forming a 3D space-scale diagram, with points still becoming great rays and 2D regions becoming cones.

Figure 9: A one dimensional space-scale diagram of six points as the view zooms in from (a) to (b) to (c) around the point q.
For comparison, compare this with a standard one-dimensional world. Here, a standard viewer is a small one-dimensional window that shows a small piece of the world (e.g., a view of a local-piece of a time-line). As the window is panned around it moves to different parts of that time line. As it is zoomed in, it would narrow its scope and look at a smaller region of the time line in detail. As it is zoomed out, it looks at a larger section.
In space-scale diagrams however, while the viewing window is also represented as a one-dimensional segment, it has a constant size and is located at a particular place in both space and scale. Thus as the user pans and zooms around the world, the viewing segment is moved rigidly (i.e., without changing its size) in space-scale. A whole sequence of such movements can be represented by a path through the space-scale diagram (Figure 10). Thus the first advantage of these diagrams is that, by reifying scale, they allow these multiscale movements to be represented statically and so are easier to analyze. For example, a pan operation becomes a horizontal part of such a path. A zoom becomes a movement along a great ray. Other types of movement correspond to curves of other characteristic shapes.

Figure 10: Basic pan-zoom trajectories are shown in the heavy dashed lines. (a) is a pure pan, (b) is a pure zoom (out), and (c) is a zoom around the point q.
The ability of space-scale diagrams to represent pan-zoom movements as a path in space-scale has allowed us to solve two concrete problems in designing good pan- zoom interactions. Both concern situations where the system needs to move the user's view automatically to another point in the space. This might happen, for example, as the result of following some sort of hyperlink mechanism, or jumping to the result of some content-based search.
The first problem occurs when the interface needs to not only move the user to some other region of the world, but also needs to zoom in. The solution to doing these actions in parallel, jointly panning and zooming to the new view, is not as simple as it might seem. However, if one simply computes how much to pan and how much to zoom and does the two independently in parallel, the result is disconcertingly non-monotonic. The pan covers distance at a constant pace while the zoom-in is magnifying the world exponentially. The result is that the target location first rushes away due to the magnification, and only later does the pan catch up. Various hacks to fix this, taking logs and powers of various things, did not work.
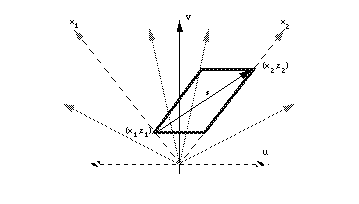
Fortunately, using space scale diagrams, a monotonic approach to the target view is captured by a kind of parallelogram constraint on trajectories in space-scale. In Figure 11, a path from (x1, y1) to (x2, y2) that goes outside such a parallelogram is non-monotonic. If the path exits the sides of the parallelogram, it will violate the monotonicity requirement in space. If the path exits the top or bottom of the parallelogram, it will violate the monotonicity requirement in zoom. A simple path that is monotonic is just the diagonal of this parallelogram. A simple coordinate transform that defines these diagrams (given in [17]) allows one to define this path analytically, and yields a rather unintuitive hyperbolic relationship between the two. We have implemented the trajectory derived from the space-scale diagram analysis and have indeed found it far superior to any uninformed effort.

Figure 11: Solution to the simple joint pan-zoom problem. The trajectory s monotonically approaches point (x2, z2) in both pan and zoom.
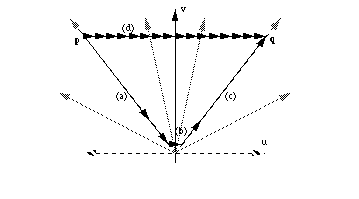
A second pan-zoom problem concerns the notion of shortest paths between two points in this pan-zoom parameter space. This is a curious question because in space-scale motions, the shortest distance between two points is not generally a straight line. This is because while panning may be expected to take a time or have a cost that is linear in the spatial separation, zoom is logarithmic, so that the fastest way to get from some point p to some point q that is far away would be very tedious by pan alone. It is in fact much shorter to zoom out, make a small pan, and then zoom in (see Figure 12.) Inspired by the space-scale diagrams we were able to define an information theoretic metric over space-scale interactions: the cost of a path is a function of the number of bits that would take to transmit a movie of the motion. Then we addressed the question of finding good paths through the space, i.e., make the movie as small as possible. We found that for points less than a few window widths away, a pure panning motion is pretty good, but for points far away, zoom must play a major role.

Figure 12: The shortest path between two points is often not a straight line. Here each arrow represents one unit of cast. Because zoom is logarithmic, it is often "shorter" to zoom out (a), make a small pan (b), and zoom back in (c), than to make a large pan directly (d)
Another use of space-scale diagrams is to represent semantic zooming, where objects change not just their size but also their appearance when they are magnified. For example, an object could appear as a point when small. As it grows, it could then in turn appear as a solid rectangle, then a labeled rectangle, then a page of text, etc. Figure 13 shows how semantic zooming differs from ordinary geometric zooming, in that the triangular regions change along the scale axis. By explicitly representing scale, the scale-dependent aspects of an object's representation can be made visible. We intend to use such diagrams to help create semantically zoomable objects. The idea is to provide an editing environment where transition boundaries could be moved or aligned by direct manipulation.

Figure 13: Semantic Zooming. Bottom slices show views at different points.
All these uses of multiscale diagrams capitalize on the fact that they statically represent scale so that multiscale concepts, which are inherently temporal, are more readily analyzed.
Copyright Computer Science Department, The University of New Mexico