Datasets - Descriptions - Tasks
Background information about the phylogeny data
Datasets - Descriptions - Tasks
Background information about the phylogeny data
We recognize that our explanation for this complex domain is far from perfect and we expect revisions to be made during the month of March. Obviously, working with a biologist will help you here!
Phylogenetic analysis uses features of organisms (such as morphological structures or molecular sequences) to construct a tree which depicts the evolutionary relationships between the organisms being examined. (see here, and
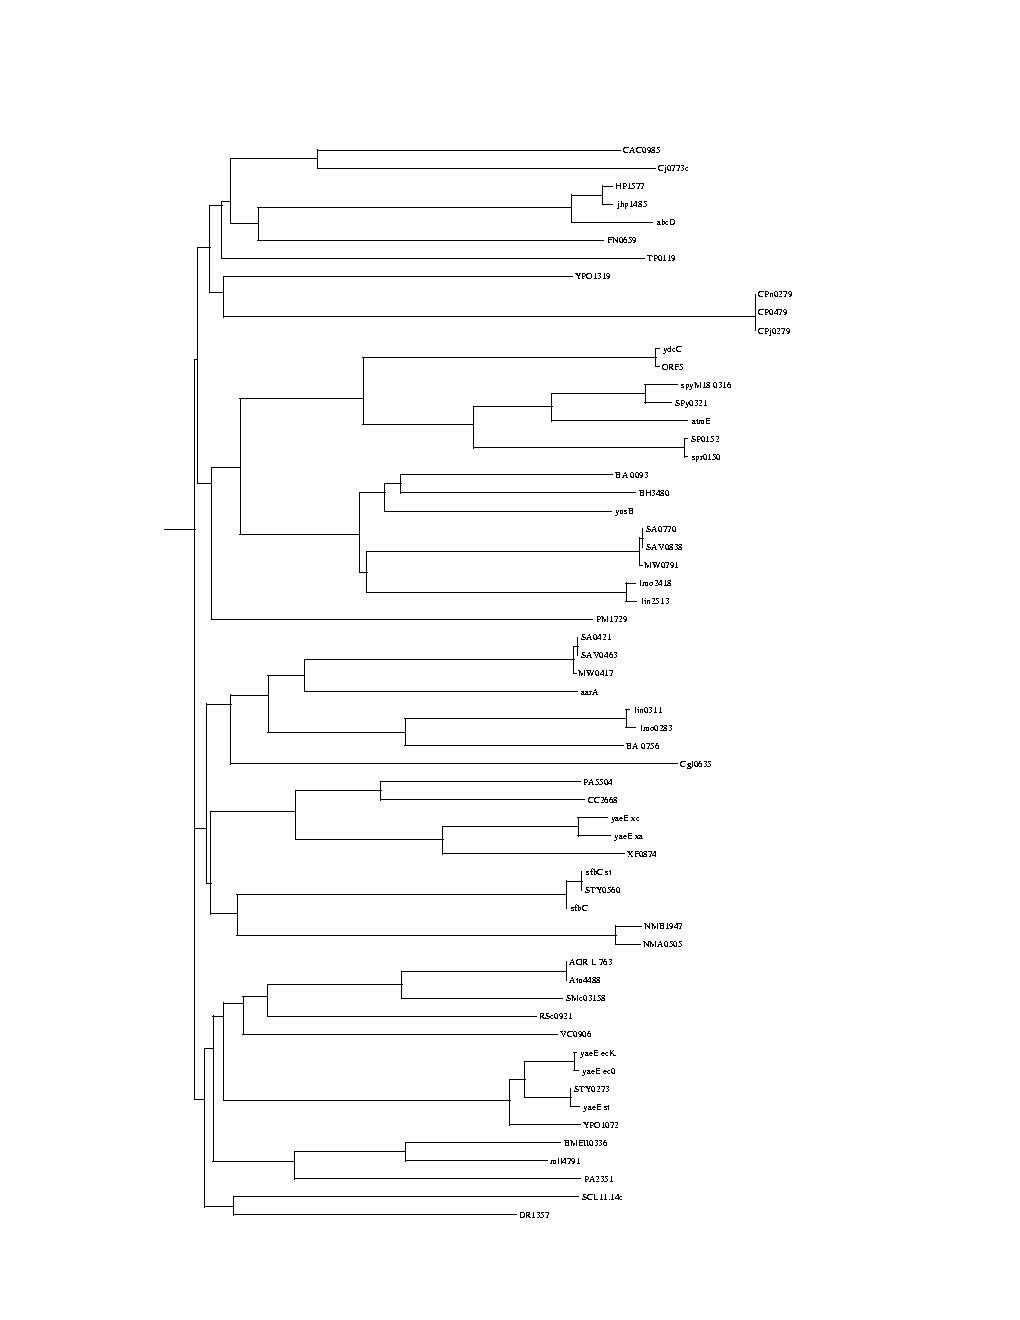
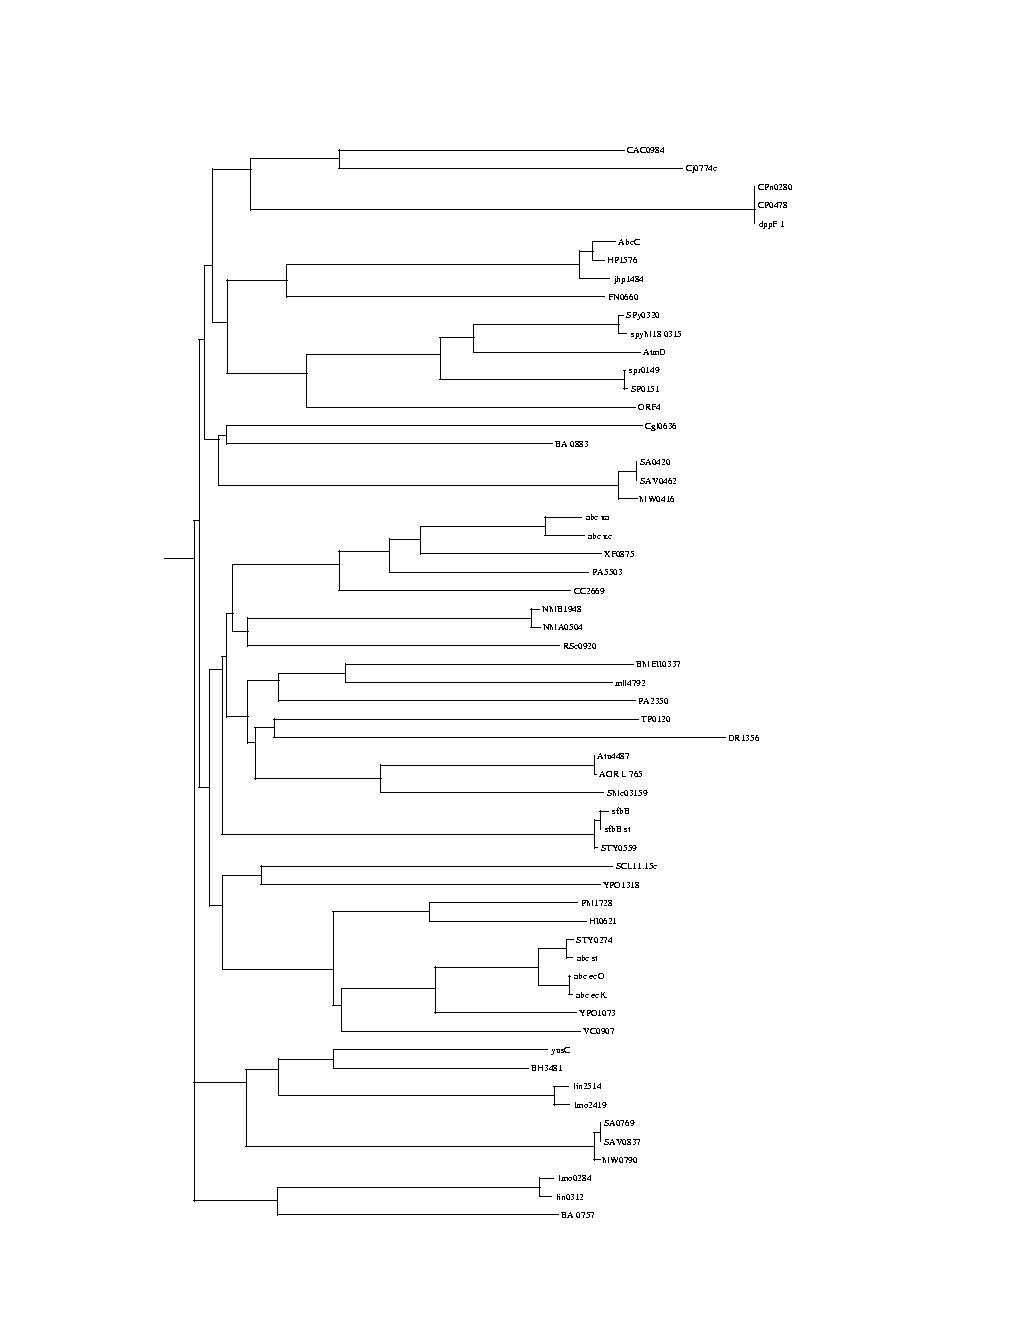
here for more information about Phylogeny.)The two phylogenetic trees we provide are binary trees, generated automatically from two sets of protein sequences (the process is described below.)
Some general context: A protein will evolve over time into a set of variants that will be found in different organisms. Each of the two trees we provide represents a protein and its set of evolutionary changes. The first tree (labeled Phylo_A_ABC) represents the evolutionary changes of protein ABC and the second tree (labeled Phylo_B_IM) the evolutionary changes of the IM protein. The leaves of the trees represent the proteins sampled from existing organisms.
Both sets of proteins belong to the ABC superfamily, more precisely to the ABCY family of transporters. The first tree was generated from a first set of proteins — described in the file ABCYabc.pir - consisting of ATPases (ABC).
The second tree was generated from a second set of proteins — described in ABCYIM.pir — consisting of integral membrane proteins (IM). ABC and IM proteins interact together in the cytoplasmic membrane of the cell to constitute the transporter. A few members of this family of proteins have been shown to transport methionine in prokaryotes.Experimentally established or predicted relationships between the two sets of proteins (ABC and IM) are described in the file ABCY.csv. In this file, proteins belonging to the same transporter in a given species are matched and listed together on the same line. In all cases, the genes encoding the IM and ABC of a transporter are adjacent on the chromosome and they very probably belong to the same transcription unit (operon). It has been suggested that these two genes co-evolve, based on the similarity of phylogenetic trees.
There is strong evidence that IM and ABC proteins of a given transporter have co-evolved. If true there should be at least one tree structure generally compatible with the phylogenies of both proteins.
To get started you could think of the problem as: The two sets of proteins (i.e. the two trees) belong to the same biological system and it is believed that they evolved in a similar way. The co-evolution of these proteins should therefore be somehow visible in the phylogenetic trees. Your goal is to show how true this is.
The leaf nodes correspond to currently existing proteins, and can be paired between the 2 trees. The ABCY.csv file gives you the correspondence, e.g.
Species;ABC;IM;
Brucella melitensis;BMEII0337;BMEII0336;
Chlamydophila pneumoniae CWL029;CPn0280;CPn0279;
Listeria innocua;lin2514;lin2513
But this is not true of the nodes higher in the trees, which do not have names (we only give them codes like ?abc12? to allow the contest participants to refer to a particular node, but those names have NO meaning). An important problem is to see how these two sets of proteins co-evolved and to draw a plausible relationship between groups of proteins represented by branches of the trees.Branch order is not meaningful in the trees. It can be misleading for comparison purposes. Practically this means that when drawing the tree each split can be drawn many different ways by flipping the order of the branches.
Branch lengths are meaningful. In general a very long link leading to a split indicates that a high number of evolutionary changes occurred before the split and therefore that the grouping below the split is a robust grouping i.e. that there is a high level of confidence that the grouping is valid.
Trees are unrooted. In lay terms this means that you could "grab" the tree at any point, "shake it" and redraw it with that point root. It is not clear that this would be useful though... or how one would guess where to grab the tree to get the best results, but this has not been explored.
The higher-level problem is to find the best way to map the similarities between the two trees topologies, which would indicate co-evolution, and, maybe, the point(s) where the two proteins were not co-evolving.
Lower-level tasks involve interacting with the tree matching process to solve inconsistencies that can arise.
Still lower-level tasks involve displaying the trees (with or without taking into account the branch length (i.e. the length of the links), showing the relationships and differences from a computed or interactively constructed mapping, and providing ways to permute links and nodes to verify hypotheses interactively.
The trees are relatively small, with 60 and 59 nodes, but the combinatorial complexity is potentially large when considering plausible matching between the trees.
Possible advanced task (super bonus task?)
Unfortunately the process used to generate a tree is only a statistical estimate of the true phylogenetic tree, and slight differences occur due to parameter variations in the various stages of the tree generation algorithms. The two trees we provided are not necessarily the optimal ones to show the co-evolution of the proteins. If you are so inclined you can regenerate variations of the two trees (using the method described below) and look for better pairs showing a better match. This is a very advanced analysis task and the more difficult challenge you can take. It is also taking you away from the pairwise comparison focus...
The original protein sequences and relationship table have been provided by Elie Dassa, researcher at Institut Pasteur, France.
Proteins of the ABC and IM set have been sequenced and are available in the two files ABCYIM.pir and ABCYabc.pir. A tree is built from each file, using the following process:
- Step 1: Calculating Proteomes Alignments
- Alignments are computed using the CLUSTALW program. The result is available in ABCYIM.phy and ABCYabc.phy.
- Step 2: Tree Drawing
- The PHYLIP drawgram program has produced several versions of the tree, e.g.:
The output of the tree computation program is an unrooted binary tree with the branch lengths.
A convenient user interface for running these programs from the web is provided by the Institut Pasteur. You access it at http://bioweb.pasteur.fr/intro-uk.html.
Relationships between proteins in the two trees has been generated by hand and annotated (see ABCY.csv.)
Alternate Methods we chose not to use
Several methods are available to generate a tree from a set of proteins. We started with a much faster method that produced poor results. Other methods can provide other trees that may or may not simplify the tasks.
- Step 1: Calculating Proteomes Similarities
- Distance between sequences are computed using the PHYLIP protdist program. The computed output is available in ABCYIM.protdist and ABCYabc.protdist.
- Step 2: Calculating Trees
- From the distances, the program neighbor computed a tree by performing successive clustering. The results are available in ABCYIM.neighbor and ABCYabc.neighbor.
Return to InfoVis 2003 Contest
Return to InfoVis 2003 Contest - Materials