Georgia
Institute of Technology – Directed Exploration
VAST
2006 Contest
Submission
July 2006
Authors and Affiliations:
Summer
Adams, Georgia Institute of Technology, summer@cc.gatech.edu
Kanupriya Singhal, Georgia Institute of Technology, ksinghal@cc.gatech.edu
Tool(s):
We created our own tool for this contest and integrated some
of the features of prefuse. Initially it was developed for a group project at
Georgia Tech for an Information Visualization course in Spring 2006. Over the
past couple of months, we have enhanced the functionality and further developed
our theory. Additional developers of the tool for the class project that did
not participate in the submission are Susan Gov and Sheena Lewis, both enrolled
in graduate school at Georgia Tech. The intent of the tool is to provide an
overview of the data and guide the user in their quest for connections in the
data. Under that premise, we included as much of the data in the tool as
possible with complementary views based on user selected filters.
TOC: Who – What – Where – Debriefing - Process
2 page summary (for publication)
1. WHO: who are the players engaging in deceptive
activities in the plot(s)?
Name
|
Most relevant source
files (5 MAX)
|
Dr. Delwin Sanderson
|
Scientific Review 3, Scientific Review 4,
1101163356450, picture081, picture082
|
Dr. Alejandro VonRyker
|
Scientific Review 3, Scientific Review 4,
1101163356450, picture081, picture082
|
Dr. Philip Boynton
|
1101163356450, picture081, picture082, picture083
|
Rex Luthor
|
1101163356450, picture081, picture082
|
Laurel Sulfate
|
picture083, picture084, picture085
|
|
|
|
(Note: ignore
the file extensions)
2. WHAT: what is the time frame in which the plot(s)
unfolded?
What events occurred during this time frame that are most relevant to
the plot(s)?
|
Time Frame |
use month/years e.g. June 1789 – April 1942 |
Provide a text list of events following the sample layout. Use short description (i.e. one or 2
lines per event)
Provide what you think is the best subset of events (20 events MAX)
|
|
Event |
Date |
Most relevance source files (5 Max) |
|
1 |
Von Ryker Institute shut down in |
Fall of 2001 |
Scientific Review 4 |
|
2 |
BSE found in Mabton |
December 2001 |
1101243512780 |
|
3 |
Boynton Laboratories founded |
May 2002 |
1101163356450 |
|
4 |
Boynton Laboratories receives contract
for BSE testing |
September 2003 |
1101163018612 |
|
5 |
John Torch enters mayoral race |
July 2003 |
1101631275108 |
|
6 |
Pictures taken of John Torch with
a woman that is not his wife |
April 2004 |
1101163356001, picture084,
picture085 |
|
7 |
John Torch essentially drops out
of mayoral race |
Summer 2004 |
1101162945890 |
|
8 |
Rex Luthor pulls ahead in mayoral
race |
Summer and Fall 2004 |
1101162945890 |
|
9 |
|
|
|
|
10 |
|
|
|
|
11 |
|
|
|
|
12 |
|
|
|
|
13 |
|
|
|
|
14 |
|
|
|
|
15 |
|
|
|
|
16 |
|
|
|
|
17 |
|
|
|
|
18 |
|
|
|
|
19 |
|
|
|
|
20 max |
|
|
|
3. WHERE: What locations are relevant to the plot(s)?
Follow this example layout.
Use only one-line per item.
|
|
LOCATION |
Most relevance source files (5 Max) |
|
1 |
|
1101163356001, Scientific Review
3, Scientific Review 4 |
|
2 |
Boynton Lab in Alderwood |
1101163356450 |
|
3 |
Mabton |
1101243512780 |
|
4 |
|
1101163977242, 1101163018599 |
|
5 |
|
|
4. DEBRIEFING
The
founders of Boynton Labs arranged for a cow in the Alderwood area to be
infected with mad cow disease. The motivation behind this was to build up
support for creating their new lab within the community and within the local
government. The discovery of mad cow disease in the
5.
VISUALS and Description of ANALYTIC P ROCESS
The first
thing we did was to try and get a feel for the depth and scope of the data set provided.
We reviewed all data provided in detail with the exception of the news stories.
For the new stories, we wrote a script to rename the files based on the
published date as shown in Figure 1 below. This allowed us to skim some
articles in chronological order. Again, the intent was to familiarize ourselves
with the data.
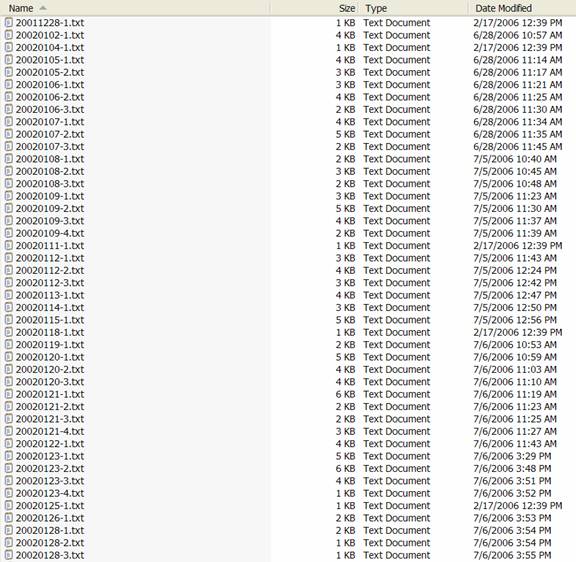
Figure 1: Articles after being
renamed based on published date.
This
process led to the hypothesis that the outbreak of mad cow disease was not an accident,
however we did not have any further details. We then proceeded to design an
interface we believed would highlight the links among what we defined as the
five primary data types: individuals, organizations, events, activities, and
locations. We focused on a creating a visualization that would assist a user in
discovering relationships among the data elements in the data set. This
approach led us to decide to use “classic” visualization techniques
combined in a novel way. We chose to use a tree map, timeline, map view,
network visualization and lists of all the entities. Once one or more entities
are selected and then the Filter option is selected, all views update to
reflect the user’s choice. As an example, figure 2 shows the
visualization with data selected and filtered.
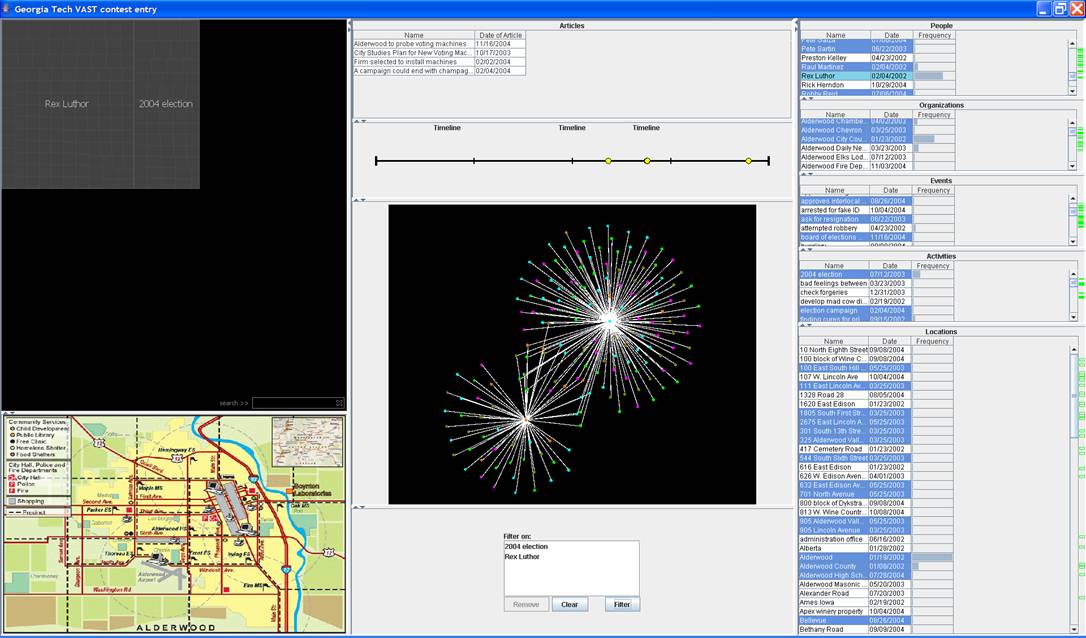
Figure 2: Example data filtered in
the visualization. The person “Rex Luthor” and the activity
“2004 election” are selected for this view.
To come to
our conclusions about the data set, we used the tool to select and then filter
on information about specific items we thought were of interest. In particular,
we started with mad cow disease and used the network visualization to see
connections to other entities, the timeline to track story headlines, and the
actual list of articles to open and read for further information. We opened the
articles by double clicking the articles of interest in the list (see Figure
4). Figure 3 shows the application with mad cow disease as the filtered entity.
We believe one of the strengths of our tool is that it helps reduce the number
of articles of interest from the almost 1200 provided to just those that appear
based on the user selected filters.
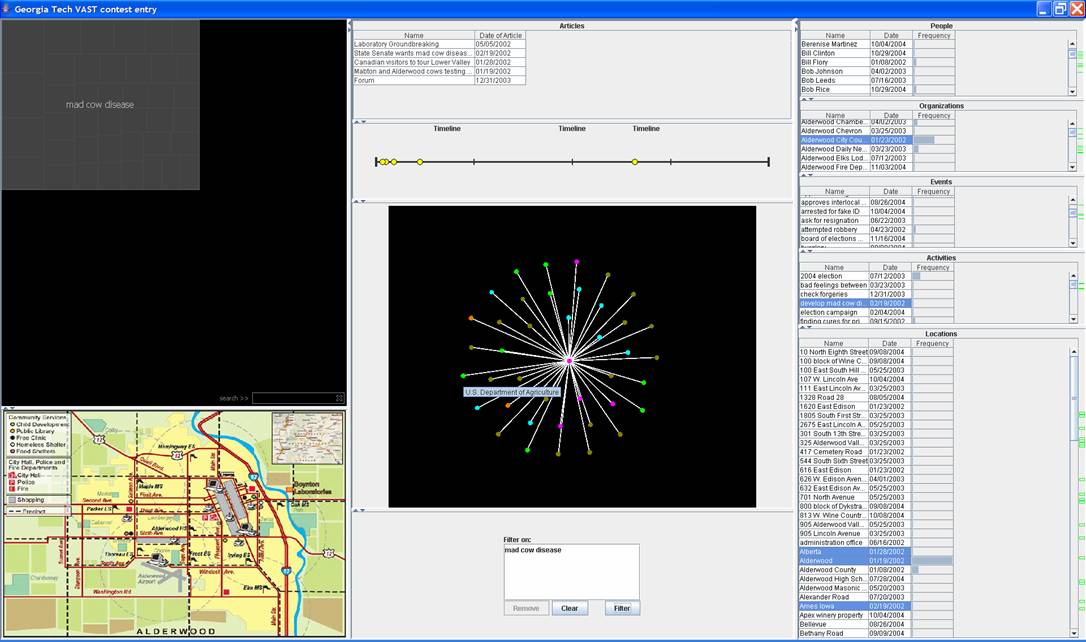
Figure 3: The visualization with mad
cow disease as the selected filter. The links to other entities can be seen in
each of the other components of the visualization above.

Figure 4: Example news article
selected by user.
We reached
our final hypothesis through directed exploration of the data using the tool.
Specifically, mad cow disease led to further exploration of Rex Luthor, Dr.
Delwin Sanderson, Dr. Alejandro VonRyker, Dr. Philip Boynton, and Boynton
Laboratories. It also led to the exploration of the source of the cow that
tested positive for mad cow disease. Looking into the Alderwood City Council
came up from the above explorations which led to the analysis of John Torch and
the mayoral election. We believe he was being set up because in the supposedly
steamy pictures, he is shown with a Boynton Labs employee having coffee but not
being inappropriate. His record on voting against liquor licenses and his
condemnation of Dr. Martin Luther King Jr. as being an adulterer led us to
believe that he is a man that stands up for his values (popular or not) and is
unlikely to have had an affair himself. The timeline view assisted in this
conclusion. It clearly displays the progression of events.
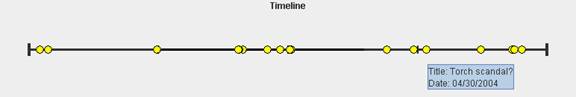
Figure 5: Timeline of John Torch
with one of the later article details displayed from a mouse over.
The strength
of the relationships between entities can be shown with ease using the
node-link graph. Figure 6 below shows the connections between Rex Luthor,
Boynton Laboratories, and mad cow disease. Multiple connections between
entities, especially if they were unexpected, lead to further analysis of the
nature of the connections.
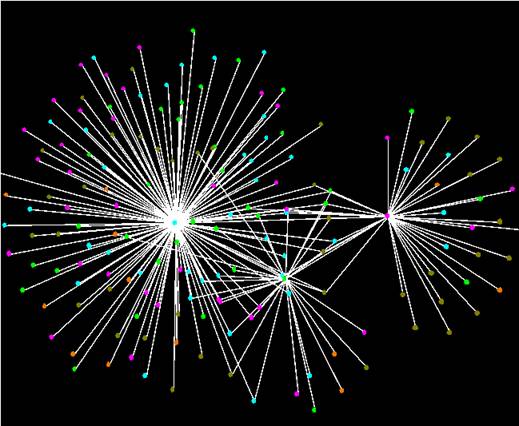
Figure 6: Node-link graph with Rex
Luthor, Boynton Laboratories, and mad cow disease.
Admittedly,
this method does take time and sometimes leads down the wrong path. However, it
provides solid direction and allows the user to make informed decisions about
what to explore next that seems most promising.
TOC: Who – What – Where – Debriefing - Process