Contest webpage: http://steel.lcc.gatech.edu/~dmccolgin/classes/infovis/Project/MonkEllipseV1.html
Authors and Affiliations:
- Lee Inman Farabaugh , Georgia Institute of Technology, lee@cc.gatech.edu
- Tzu-Wei Hsu, Georgia Institute of Technology, thsu@cc.gatech.edu
- Dave McColgin, Georgia Institute of Technology, davemail@cc.gatech.edu
- Kevin Stamper, Georgia Institute of Technology, kstamper@cc.gatech.edu
Tool(s):
We used PERL extensively, both to find additional content for the database, and to develop our categories and classify authors and papers. Our subsequent database is in PostgreSQL. The final program can run in any browser with the Flash plugin, and was created with Flash MX2004 and ActionScript 2.0. Flash communicates with the PostgreSQL database using an intermediate PHP page.
TASK 1: Static Overview of 10 years of Infovis
- Process :
Research areas, or topics, were derived by first parsing out all of the keywords
and counting the number of times they occurred. Next, we printed all of them
out, cut them up, and manually arranged them into semantic groups. We defined
each group with a tentative topic name. Topic names came from past topics
in the InfoVis conference listings, lecture titles from Dr. John Stasko's
class in InfoVis, and from groups of keywords that suggested a collective
heading. We iterated this process until we arrived with a final set. Our database
contains each portion of a document: date, abstract, references, etc. It also
holds our derived categories and a list of all authors. MonkEllipse arranges
each document title dynamically in an ellipse. Clockwise from the top, the
documents are listed in chronological order. Shaded sections with year indicators
provide further information regarding chronology. The derived topics are scattered
in the center and sized according to the number of documents within them.
Documents and topics affect one another when selected if they are related.
In developing support for interactive tasks, we wanted to minimize both the
number of 'modes' and the changes to the function or appearance of visual
elements. It is easier for the interactor to learn and predict the effects
of his actions with a single flexible display than it is to learn a number
of task-specific modes and interactions. Early on, we noticed that this approach
produced a pleasing display that could statically show chronology, evolution,
and the names and relative influence of our derived research areas.
- Image 1.1:
- Insight :
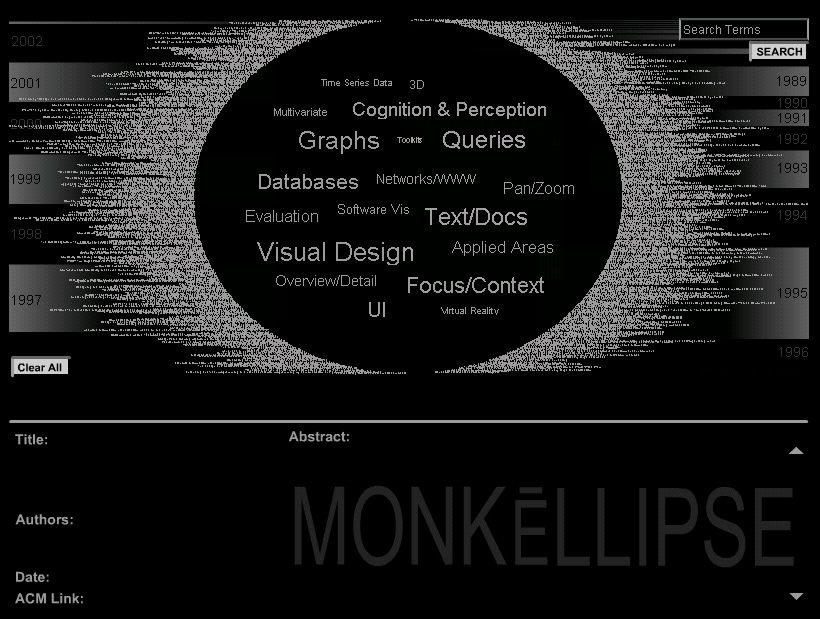
This image is of the system before any interaction occurs. The documents are
arranged chronologically around the ellipse, clockwise from the top. Research
areas, derived from InfoVis Conference listings of the past and Dr. John Stasko's
InfoVis lectures, populate the center of the ellipse. Documents were categorized
into the derived topics based on keywords or abstracts, dependent upon whether
or not keywords were available. The size of the topics displayed in the center
of MonkEllipse conveys the relative size and influence of each research area
within Information Visualization. The year indicators surrounding the document
titles show the distribution of publications within each year.
- Caption for exhibit:
InfoVis documents from the past 10 years are arranged chronologically
in an ellipse. Research areas are displayed at the center of the documents
they abstract. Their size shows the relative number of documents within each
research area, and thus, the roots and direction of the field as a whole.
Year indicators show the distribution of publications for each year.
- Image 1.2:
- Insight :
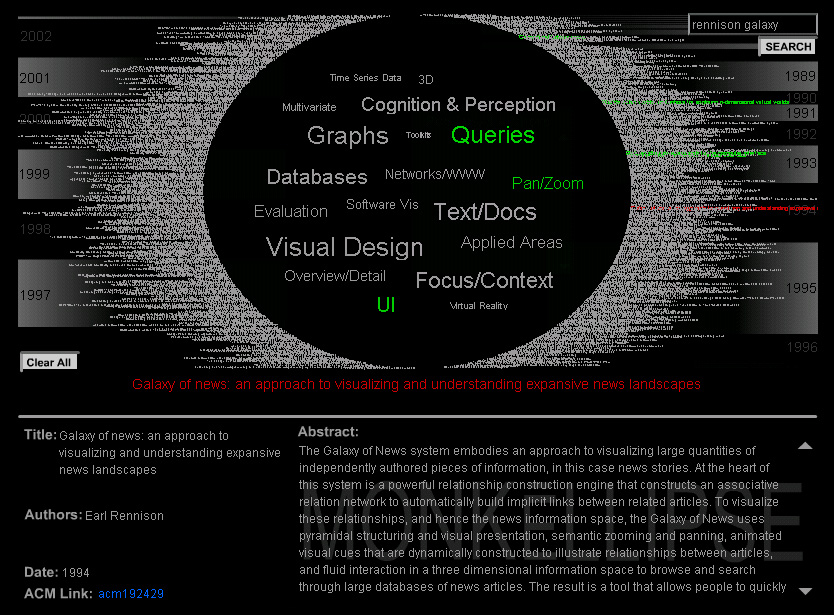
As discussed above, screenshots of actual interaction can provide visually
interesting and informative still images. This allows the interaction itself
to come through in the image, adding another layer to the evolution of Information
Visualization, which the system explores. In the image above, the interactor
searched for a specific author and document, then clicked on the returned
document (in red). The green documents are those referenced by the red document;
the green topics are those it falls under. The bottom pane displays document-specific
information. Underlying all of this, every single InfoVis document of the
past 10 years is arranged chronologically in an ellipse: an elegant, textured
representation of the field. The background shading of years indicates years
where research in InfoVis was more or less popular. Our research areas are
displayed at the center of the documents from which they are derived . Their
size shows the relative number of documents within each research area, and
thus, the roots and direction of the field as a whole.
- Caption for exhibit :
InfoVis documents from the past 10 years are arranged chronologically in an
ellipse. Our research areas are displayed at the
center of the documents from which they are derived. Their size shows the
relative number of documents within each research area, and thus, the roots
and direction of the field as a whole. Year indicators show the distribution
of publications for each year.
TASK 2: Characterize the research areas and their evolution
- Process :
In order to characterize the research areas, we came up with a set of topics
under which we thought each of the articles could be classified. Our basic
method is described above. We arranged these topics in the center of our visualization.
Their size shows the relative number of documents within each research area,
and thus, the roots and direction of the field as a whole. In order to see
the articles that fall under a given topic, the interactor clicks on its name,
which highlights all the articles with related keywords (the abstract was
used if keywords were missing). The article titles are positioned according
to an ellipse formula in chronological order around the topics. Thus, article
highlighting allows the user to see temporal trends in the research area,
such as the first paper published, clusters of more prolific publication in
specific years, or a gradual increase in publications over time. Of course,
research areas can also be characterized by their contributors. When a topic
is selected, researchers who are published in that topic are shown. Their
order is arranged according to our calculated Influence Factor (IF), a number
based on the authors' publications in the field and the number of times they
are referenced. When a document is selected, all the topics it falls under
are highlighted. With the current infrastructure, one could also add support
for selecting multiple topics, highlighting documents with different effects
to show their combined influence as well as the amount of overlap between
topics. Topics would then be toggle switches--once to select, again to deselect.
We have prototyped several ways of supporting multiple topic selection, but
have not had the time to implement them.
The most pervasive problems we encountered were inconsistencies and omissions
in the dataset. Some documents had little more than a title, and we did our
best to gather further information. Many authors and keywords were spelled
differently due to inconsistent punctuation or errors. Documents with such
problems were more difficult to accurately classify with our parser algorithm.
We tried many different color schemes to ensure that all of the screen objects
are visisble and that hilighted objects stand out. The dark background allowed
different colors to be more easily distinguishable from one another and still
have unselected objects clearly visible. Another problem we encountered dealt
with maximizing screen real estate. With 614 article titles arranged on a
single screen, we had to experiment with size and rollover effects to ensure
individual items could be identified and selected as our current version shows.
Some article titles continue off-screen when rolled over, and so we added
an echo of the rolled over title just beneath the ellipse, even matching size
and color. Finally, because we wanted to keep the same basic interface for
a variety of tasks, we had to find space to display the authors within a selected
topic, the articles in that category, and keep all the topics available for
interaction. We accomplished this with an animated change in the topic layout
based on the user's actions. When a topic is selected, all topics moved quickly
to a position that leaves room for the list of authors in the topic. The animation
begins very quickly and slows down at the end so that the interactor perceives
a fluid, understandable change. Unfortunately, the animation only displays
as we intended if, once an action to change the layout is taken, the cursor
is moved to the very edge of the screen. Otherwise, we believe mouse events
fire behind the scenes that slow the animation considerably. When the author
list is not needed, the space is reclaimed in order to leave only appropriate
interactive objects onscreen, as well as improving aesthetics.
- Image 2.1 :
- Insight 2.1 :
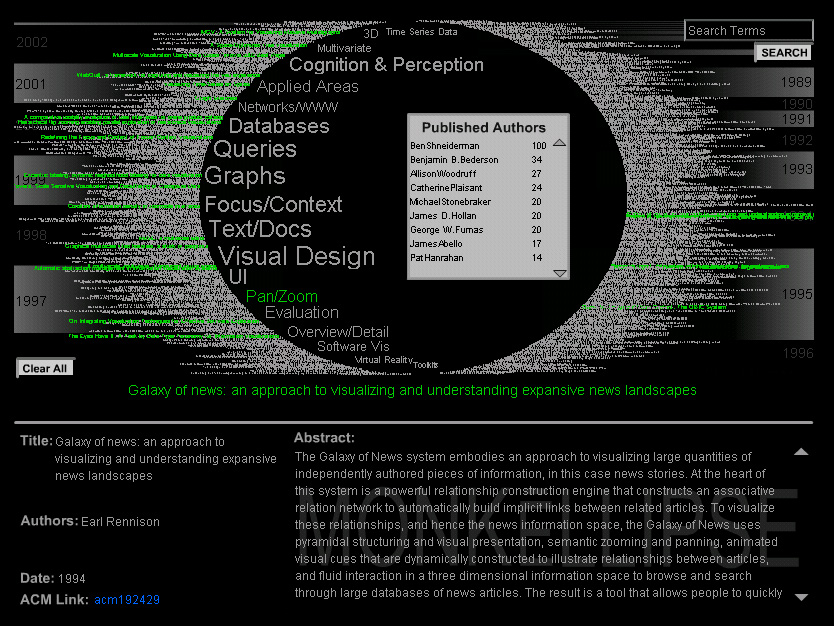
The bottom pane that holds title, authors, date, abstract, and a direct web
link to the document in the ACM library, was populated due to a previous document
selection. To support exploration with this information still present, this
data is not removed or replaced until another document is selected. The interactor
has clicked on the topic "Pan/Zoom." As a result, the database returned
all related articles and all authors who have published in this area. The
related articles have turned green and are slightly larger to assist accurate
rollover and selection. Having the entire 10 year history in one view takes
advantage of the our ability to see clusters and trends in data. In this image,
there is a noticeable increase in publications over time, starting with the
first publications in 1994 and 1995 (on the right), which appear to be the
birth of this topic. Rolling over the first 3 articles highlighted in the
1994 section shows that "Galaxy of News...", "Powers of Ten
Thousand..." and "Pad++" may be preliminary work in the area.
Visually following the ellipse clockwise, it is clear there are progressively
more publications in that area as time progresses. The left side of the ellipse
reveals an increased number of green articles that are consistently spread
out with a few articles each year from 1997 to present, indicating the establishment
of Pan/Zoom as a valid research topic within InfoVis since its origination.
Shneiderman and Bederson are leaders in the field, as evident from their top
position in the list and their Influence Factors. Indeed, clicking through
the articles in the topic shows that Bederson authored one of the first three
articles.
TASK 3: The people in InfoVis
Task 3.1: Where does a particular author/researcher fit within the research areas defined in task 2?
- Process :
The task of discovering where a particular author/researching fits within
the research areas is difficult, as there are a multitude of researchers in
InfoVis and many of them are involved in multiple research areas within InfoVis.
As our system stands now, the simplest way to find a particular author/researcher
is to search the author's name. The results of this search return all articles
associated with the researcher, regardless of whether the researcher was an
author of the article, referenced by the article, or mentioned in the abstract
of the article. Looking just at this view, while we can not garner where the
researcher fits within the research areas, we can get an idea of how long
this particular researcher has been involved in the field of Information Visualization,
which is interesting in and of itself. Continuing on, clicking on any of the
returned articles reveals the research area(s) into which the article fits.
Based on the relationship between the researcher and the article, we can then
determine the relationship between the researcher and the returned research
areas. Sometimes, we are not interested in which research area a particular
researcher fits, but rather, which researchers are involved in a particular
research area. The process to accomplish this task is simple: a quick click
on the topic of interest will return a list of authors who have contributed
to the chosen research area.
One final note: In considering different ways to accomplish this task, we
entertained the idea of having an author view in MonkEllipse. The author view,
put simply, would be almost an exact opposite to the topic view currently
implemented. With the authors in the center of the ellipse, you would then
be able to click on an author to return all articles by that author, along
with a list of research areas to which the author as contributed. However,
in prototyping the author view, we found a great increase in complexity, mostly
due to the massive number of authors/researchers in the field of Information
Visualization. Thus, this view has not been implemented; however, we believe
that with the intricacies worked out, the author view of our system would
serve this task well.
- Image 3.1.1 :
- Insight :
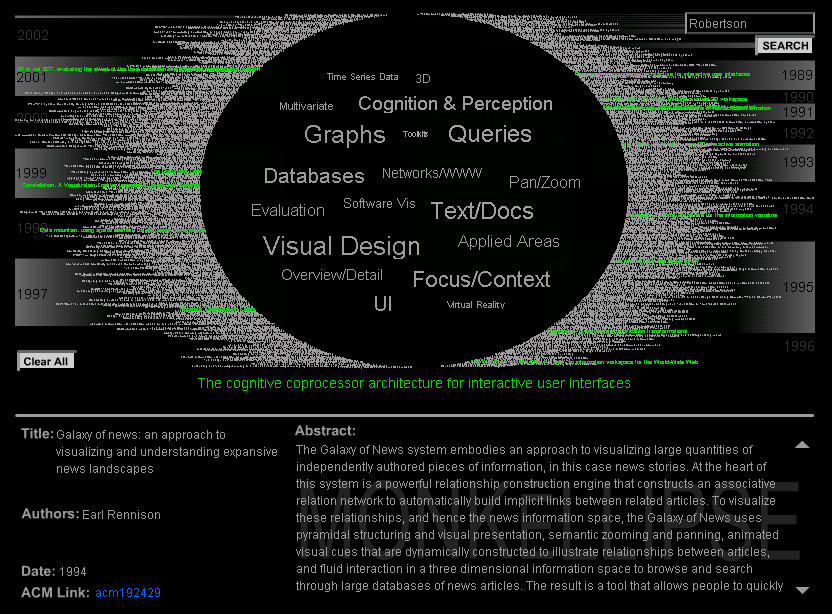
Results returned from searching Robertson reveals that George Robertson has
been a consistent contributor to the field of InfoVis, in research and in
influence, almost since its origination (1989). Scanning through the returned
results, one finds that in addition to a continued contribution to the field
of InfoVis in general, Robertson's research is not limited to a specific topic
in Information Visualization, but adds to the field of InfoVis as a whole.
- Image 3.1.2 :
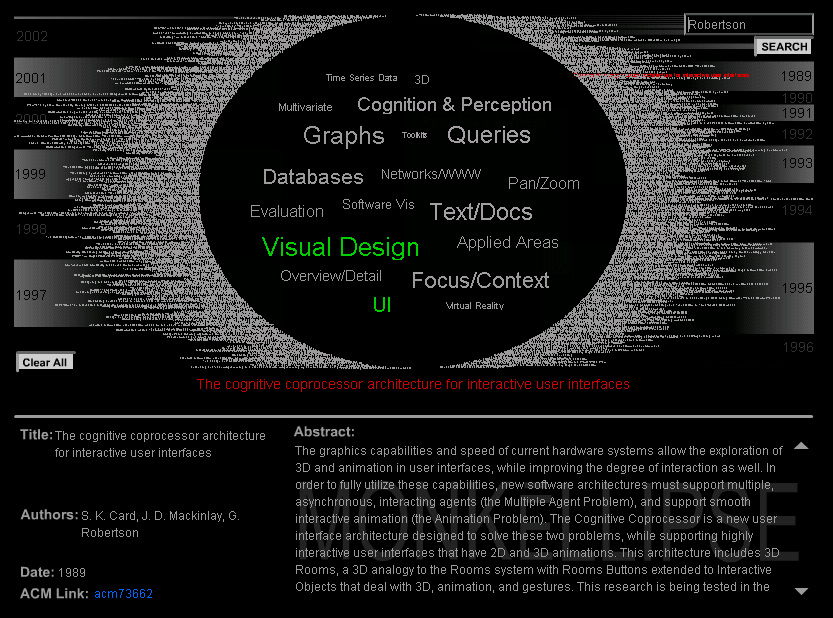
- Insight :
The image above is the result on clicking on the first highlighted article
published by Robertson in 1989. It displays the result of clicking on this
first article, revealing that Dr. Robertson's first initial work in Information
Visualization was in the areas of Visual Design and UI. Further interaction
with the search results (shown below as Image 3.2.1) we find that the most
recent highlighed article, published by Cockburn and McKenzie in 2001, builds
on Robertson's Data Mountain, as indicated in the abstract. In actuality,
exploring all the references to the Cockburn and McKenzie article, one finds
that all references are previous articles published by Robertson, with the
earliest one being "Cone Trees: animated 3D visualizations of hierarchical
information." From this, we can conclude that Dr. Robertson has done
much work in the field of Text/Docs, the research area of Cockburn and McKenzie's
article. Exploring futher, we find that the most recent article by George
Robertson is "The Document Lens," published in 1999. This article
once again fits into the research area of Text/Docs, further supporting our
earlier assumption. Note that "The Document Lens" also deals with
Focus + Context and Overview/Detail.
- Image3.1.3:
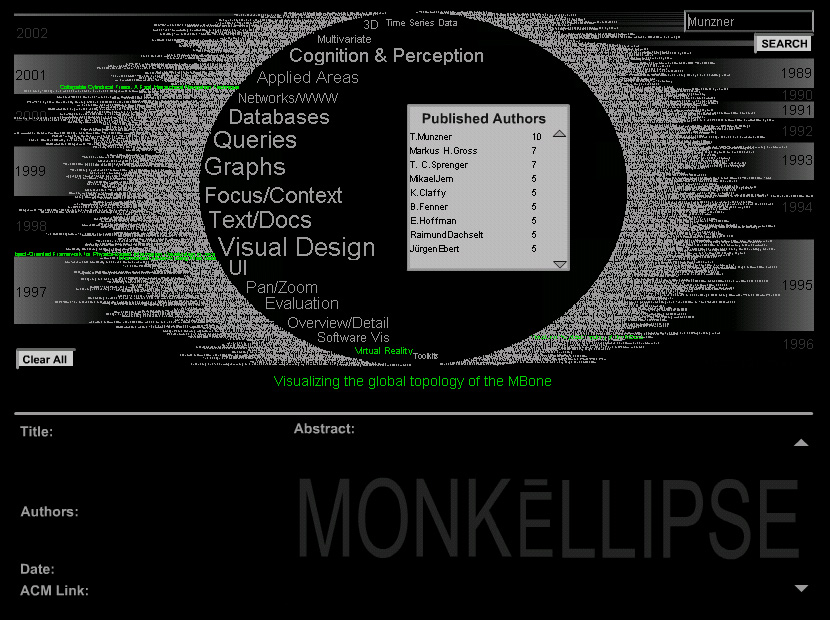
- Insight:
Given that Virtual Reality is a newer area of research, as compared to the
other topics, one may be inclined to find out more about Virtual Reality and
the researchers interested in said topic. As mentioned above, we can discover
which researchers have contributed to a specific topic simply by clicking
on the topic name. In the above image, Virtual Reality has been clicked, returning
not only documents that fit into topic, but also the authors/researchers who
have published in this topic.
Task 3.2: What, if any, are the relationships between two or more or all researchers?
- Process :
We did not focus on this task in particular; however, MonkEllipse does reveal
relationships of co-authorship and influence between researchers. Since document
details are made available when a document is selected, we can quickly discern
a relationship between the co-authors in the article's topic. The published
authors list that results from clicking on a topic is another way to identify
relationships between researchers. Regardless of whether or not the researchers
in that list have co-authored a paper, we can still surmise an intellectual
relationship between the authors due to a mutual interest in a particular
subtopic of Information Visualization. Finally, the references of a document
reveal one author's influential relationship on the author of said document.
Regarding the conceptual author view mentioned above, this task is another
that would be better served by the author view. In this case, we can imagine
a visual display of relationships between authors by selecting a single author.
- Image 3.2.1 :
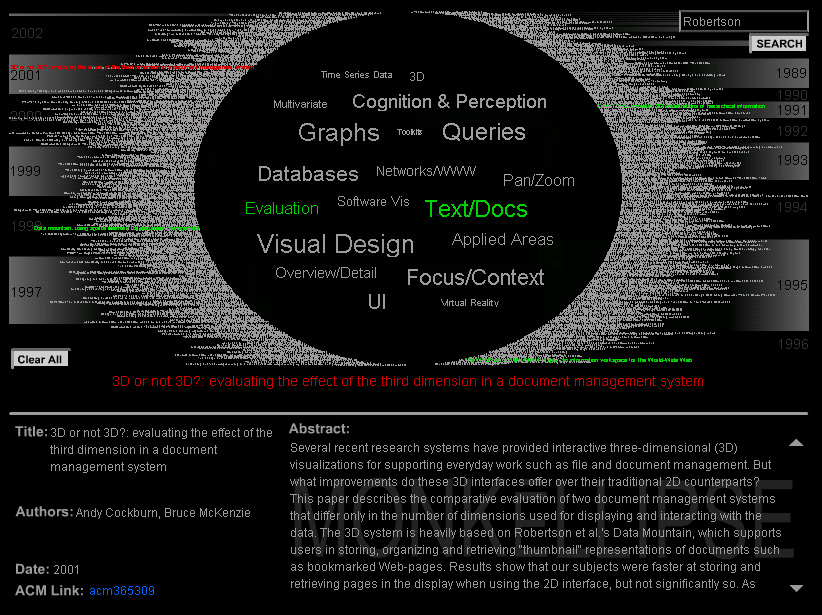
- Insight :
The image above is the result of selecting the most recent article returned
by searching Robertson for Task 3.1 above. Revealed in the document details,
this article is actually one co-authored by Cockburn and McKenzie. The abstract
of this article reveals that the 3D system of interest in this article was
"heavily based on Robertson et al's Data Mountain." This in and
of itself shows Robertson's influence on this paper. Furthermore, backtracking
through the green references shown above, one will find that all three references
displayed were authored by Robertson, strengthening the influential relationship
of Robertson on Cockburn and McKenzie.
- Image 3.2.2 :
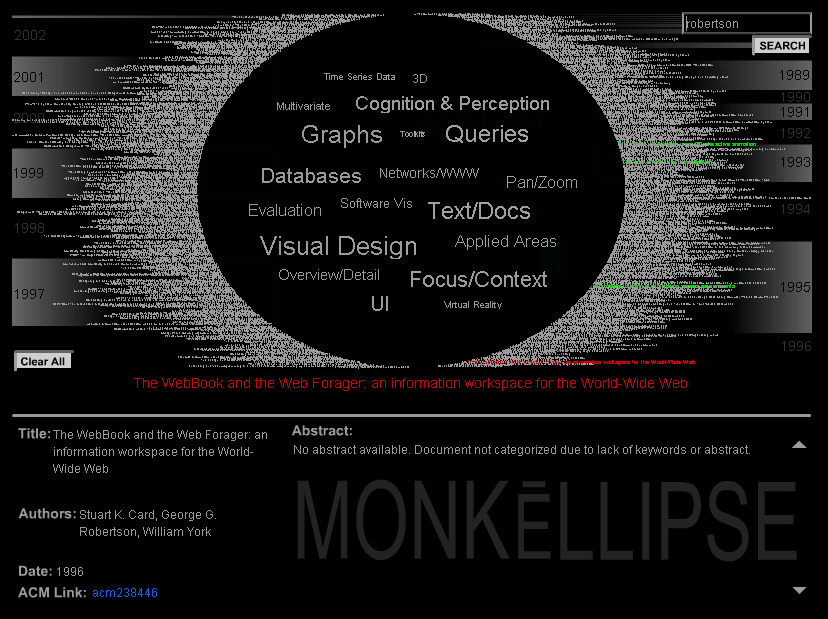
- Insight :
Ultimately, the task of finding the specific relationship between Robertson
and Card would be best supported by the author view as discussed above. Despite
this, MonkEllipse, as currently implemented, does not support this task well
even though some amount of information can still be retrieved. By visually
scanning the results of searching first Robertson, and then Card, the user
is able to determine which articles overlap in the results. In the image above,
the WebBook and WebForager article was relatively easily pinpointed as an
overlap. Selecting this document, the relationship of a co-authorship between
Robertson and Card is confirmed in the returned author list.
OTHER TASKS (optional)
Task 4: Finding details
Task 4.1: Search
- Process:
Our straightforward interface was advantageous again in supporting searches
for specific information. The search field and button are always present in
the upper right corner of the interface. When the interactor clicks in the
field, it goes blank if "Search Terms" had been there, or keeps
his previous search so that he can delete or modify it. Once he clicks the
search button or hits "enter," the server is contacted to check
for exact or partial matches. All current highlights are cleared except for
the currently selected document (if there is one), which remains red. When
the results are returned, the titles of documents with matches are highlighted
(in green), again with a slightly larger size than their neighbors. The titles
can be rolled over to explore the search results and the highlighting remains.
When a document is selected, the highlighting is cleared, the clicked document
is turned red, and when its references are returned by the server they become
green. The document's details are displayed in the bottom pane. This functionality
allows searching for specific documents or broad themes.
- Image 4.1:
- Insight:
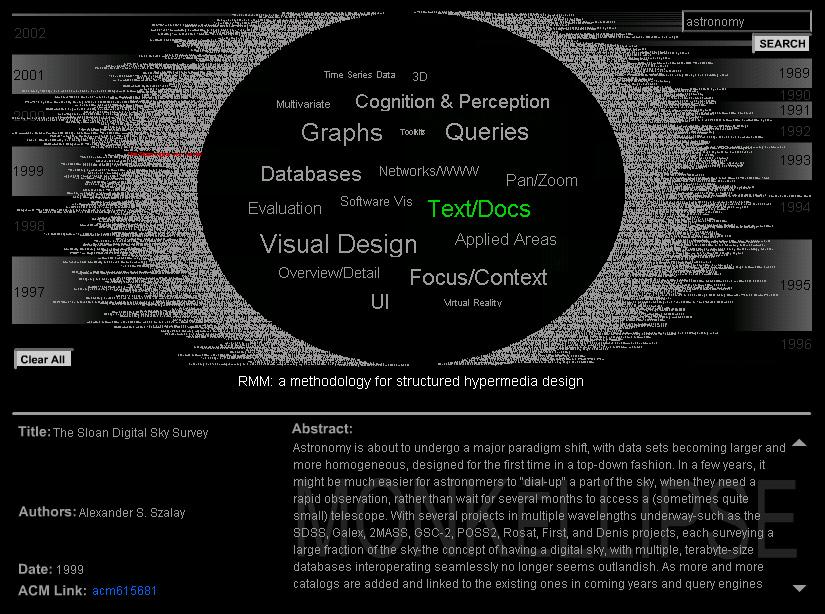
Above is the document that would be returned to an astronomer who is curious
about whether or not any visualization tools have been developed for the field
of astronomy. Reading the abstract, the interactor would be pleased to discover
that there is, indeed, work being done. However, since only one article was
returned, we can see how this particular task would have been monumentally
more difficult without the ability to search.
Task 4.2: Document details
- Process:
Any time an article is selected, the details of that article are
displayed in the lower pane of MonkEllipse. In addition to the basic information
relevant to a document, such as title, author(s), date, and abstract, there
is also a direct link to the selected document in the ACM Digital Library.
This lower pane, along with the ACM link allows the user to first determine
if this article warrants further exploration by providing the article's abstract.
If indeed the article is of interest to the user after reading the abstract,
he can then quickly and efficiently access the article via the ACM direct
link, as opposed to having to manually search the ACM Digital Library (or
any other part of the web).
- Image 4.2:
- Insight:
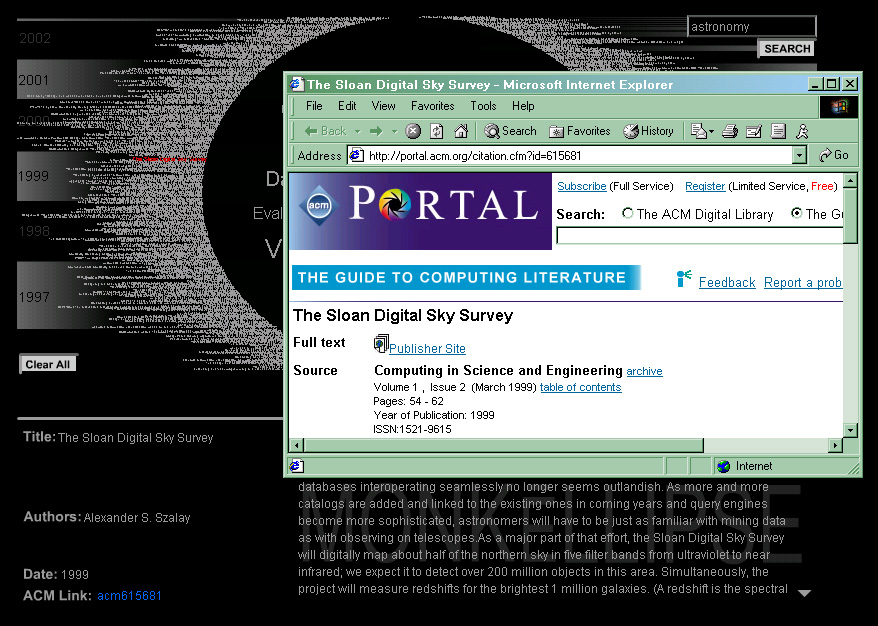
In the image above, we can see the result of following the ACM Link from the
lower pane of MonkEllipse. Returned is another window which contains the user's
search results, had they manually searched the ACM Digital Library. From here,
the user could then access the full text of the document of interest.
Web Accessibility