InfoVis
2004 Contest
Information Visualization Research: A Citation and Co-Citation Perspective
Contest webpage: www.pages.drexel.edu/~cc345/ (personal homepage)
Authors and Affiliations:
- Chaomei Chen, Drexel University, chaomei.chen@cis.drexel..edu
Tool(s):
CiteSpace v. 1.024. CiteSpace is a
Java application developed by Chaomei Chen at
Chen, C. (2004) Searching for
intellectual turning points: Progressive Knowledge Domain Visualization. Proceedings
of the
TASK 1: Static Overview of 10 years of Infovis (Note: 3 overviews of this task are included for consideration)
- Process 1.1A:
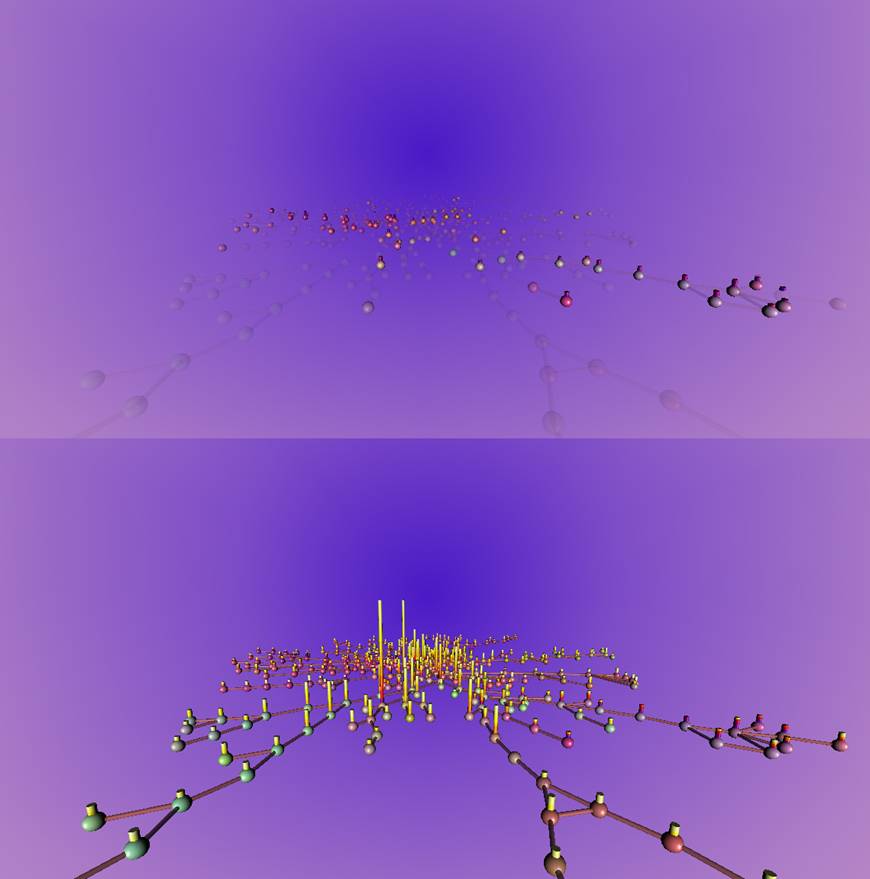
This is an overview of information visualization research from a citation and co-citation perspective. It is generated by GSA in VRML. Citation bars are superimposed on a co-citation network pruned by Pathfinder network scaling. Nodes are articles that have at least 2 citations in the dataset. Links are salient co-citation associations selected by Pathfinder. Articles of similar colors tend to be cited in a similar way in the dataset, which is determined by Principal Component Analysis (PCA). Articles from the IEEE InfoVis Symposium series itself are highlighted by glowing colors. Users can use various controls to examine the VRML model (see video clip). - Image 1.1A
: A citation landscape
of information visualization. The base network is a co-citation network.
Glowing nodes are papers in the IEEE InfoVis
Symposium series. Articles cited more than 15 times are labeled on the top
of their citation bars. The color of a node denotes the specialty membership
of the underlying article.
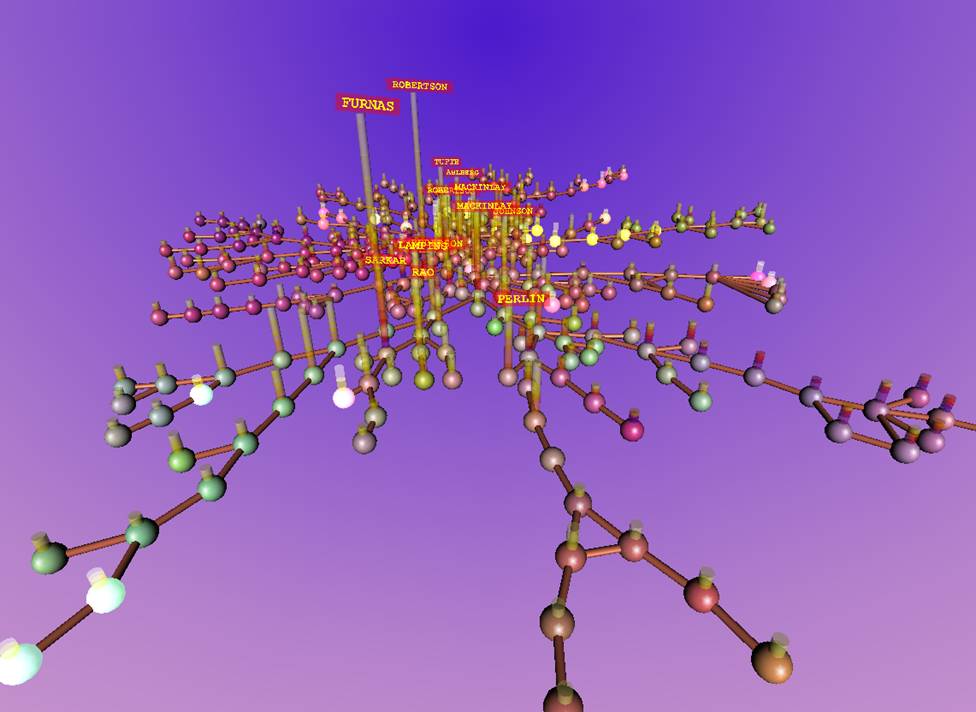
- Insight 1.1A:
The citation landscape is centered around two articles, namely Robertson et al.’s conetree paper and the fisheye view paper by Furnas. Both have the tallest citation bars in the scene. The second tier in terms of citations includes Tufte’s book, Ahlberge’s dynamic queries paper, Mackinlay’s two papers, Johnson’s treemap paper, Lamping et al.’s hyperbolic view paper, and Sarkar’s fisheye paper. The large area of red papers in the image has no native InfoVis papers (no glowing spheres). The area contains graph drawing papers published outside the InfoVis symposium. Several glowing spheres are surrounded by green neighbors, which belong to the second largest specialty in the field. Overall, the landscape shows a single structure with no distinct clusters formed as we might have seen in other fields. - Caption for exhibit:
A 3-dimensional overview of the information visualization literature. - Process 1.1B:
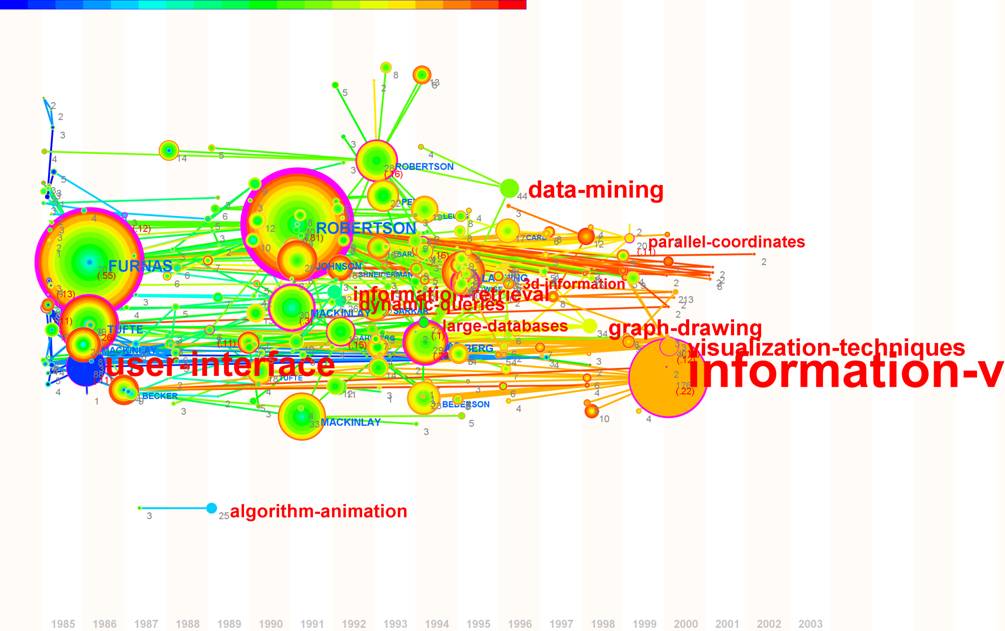
This is an overview of information visualization research from a citation and co-citation perspective. It is generated by CiteSpace, which extracts title/abstract/keyword terms and the references of each article from the contest data. To be included in the image, an article must be referenced more than a threshold value, in this example, two citations per time slice. All chosen terms are associated with a sudden jump during the period of 1985-2002. A hybrid network of terms and articles is constructed. Nodes are either terms or cited references, whereas links are either article-with-article co-citations or term-to-article citations. Node labels appear to the right of node symbols. The size of a tree-ring node symbol is proportional to the occurrence frequency. Rainbow color mapping is used; we are aware of its problems, but it is good enough for our present needs. Purple rings are high-betweenness-centrality nodes. CiteSpace provides various interactive controls over the amount of information in the display. This image corresponds to citation patterns across the period of 1985 and 2003. See also short video clips included. - Image 1.1B
: The history of change
in a hybrid bibliographic referencing network.
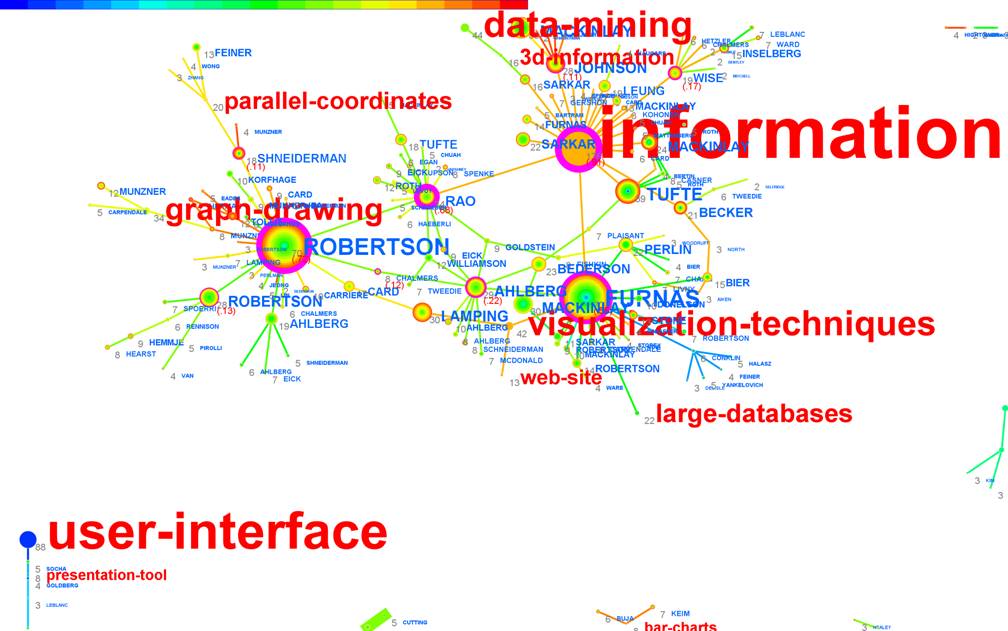
- Insight 1.1B:
The overview image shows the essence of the field, namely the key themes and landmark articles and associations among theme. Purple ringed nodes are graph-theoretically important ones, suggesting potential focal points in the field. The predominant thematic terms include ‘information visualization’ (the largest one in red, the word visualization falls outside the screenshot), ‘data mining,’ ‘graph drawing,’ and ‘parallel coordinates.’ In addition, the image highlights landmark articles, i.e. highly cited articles shown as large tree rings. Robertson et al.’s conetree article and Furnas’es fisheye view article are apparently the most predominant ones. The network is a pruned version of the original merged network of individual networks. The pruning is done by Pathfinder network scaling. In comparison to our experience with other subject domains, one observation is that the infovis field has a tightly coupled co-citation network; the entire network cannot be decomposed into natural and distinct clusters, and it cannot be reduced to a tree structure if equal-weight links are allowed. - Caption for exhibit:
A visualization of a hybrid network of articles and terms in the information visualization research. - Process 1.1C:
This is a TimeZone view of information visualization research from a citation and co-citation perspective. It is generated by CiteSpace, which extracts title/abstract/keyword terms and the references of each article from the contest data. To be included in the image, an article must be referenced more than a threshold value, in this example, two citations per time slice. All chosen terms are associated with a sudden jump during the period of 1985-2002. A hybrid network of terms and articles is constructed. Nodes are either terms or cited references, whereas links are either article-with-article co-citations or term-to-article citations. Nodes are chronologically placed across in a series of consecutive time zones (left = earlier, right = recent). Node labels appear to the right of node symbols. The size of a tree-ring node symbol is proportional to the occurrence frequency. Rainbow color mapping is used; we are aware of its problems, but it is good enough for our present needs. Purple rings are high-betweenness-centrality nodes. CiteSpace provides various interactive controls over the amount of information in the display. In this image, articles published before 1990 are lumped together immediately prior to the 1990 time zone. - Image 1.1C
: The history of change
in terms of the buzz words and phrases in the bibliographic dataset..
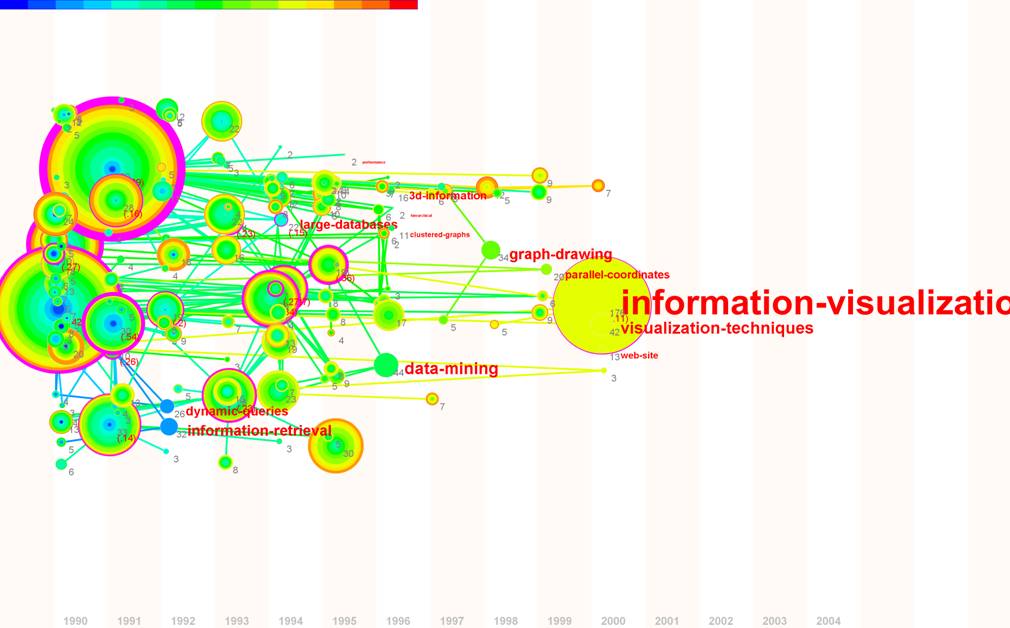
- Insight 1.1C:
The TimeZone overview shows that the field has experienced several surges of interest since 1990. In 1992, there was a surge of interest in “information retrieval” and “dynamic queries” as shown in the image (the time scale is shown at the bottom of the image). In 1994, there was sufficient interest in “large databases.” In 1996, “data mining,” “3d information,” and “clustered graphs” were particularly popular topics. In 1998, the topic of “graph drawing” was predominant. The term “information visualization” itself did not reach the top-ranked terms until 1999. One can trace each hot topic from this graph to the references associated with the topical surge. The details of references are suppressed in this particular screenshot, they will be explained in subsequent figures in this document. The two large tree-rings on the left tell us they are groundbreaking articles for infovis. - Caption for exhibit:
The TimeZone view in CiteSpace showing a number of thematic changes since 1990 in information visualization research. - Other Images (optional): Lower-level terms are shown in the following image over a longer period of time (1985-2004, the contest data does contain 2004 references).
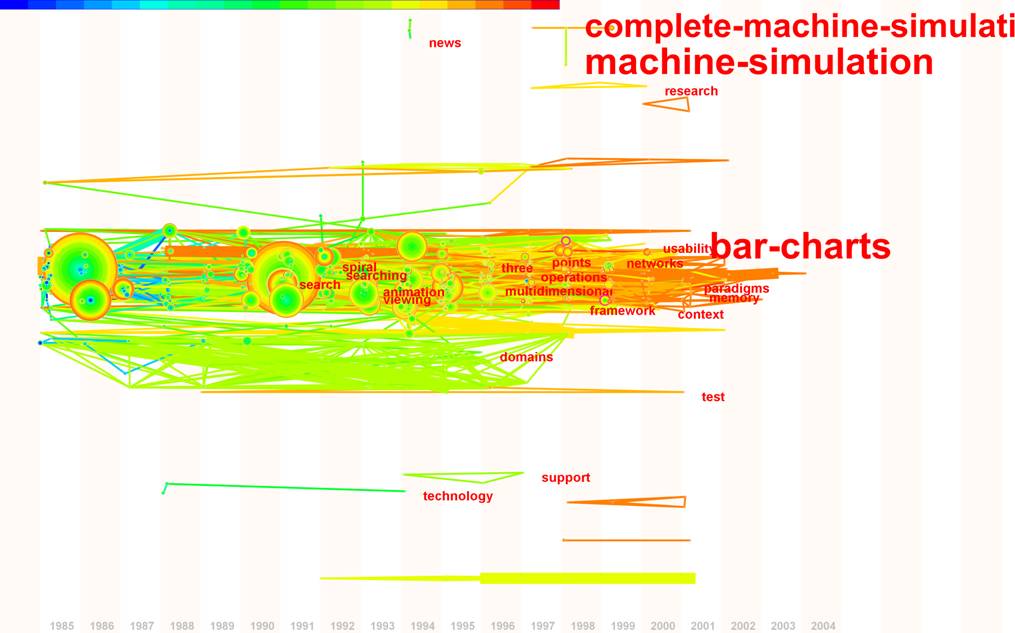
- Insight: The lower-level terms elaborate high-level terms in Image 1.1, for example, ‘search’ and ‘searching’ for ‘information retrieval.’ Additional terms are also informative, such as ‘multidimensional’ in 1996, ‘networks’ in 1999, and ‘usability’ in 2000.
TASK 2: Characterize the research areas and their evolution (Note: 2 views presented: 2.1A and 2.1B)
- Process 2.1A:
The growth of the literature is modeled in a 3-dimensional animated visualization. The evolution is modeled as a state space. An article can be in the following states: prior to its publication, publication but prior to its first citation, and first citation. A pair of articles can have the following co-citation states: before both papers are published, after both papers published but not cited together, and after both have cited together for the first time. State transitions are visually coded as the change of transparency levels in the scene from semi-transparent spheres and cylinders to opaque ones.
· Image 2.1A: Replaying the history: views from the animated visualization of the growth of the literature of information visualization (derived from the contest dataset).
- Insight 2.1A:
Watching areas where papers become solid first tells us where
the earliest influence to the field came from. The red area emerged first in
this case. We also know from the overview task that InfoVis
symposium papers tend to be surrounded by green neighbors. The green specialty
appears to represent the central themes of the symposium. Mouse-over each
sphere can give the user more details of the underlying article.
- Process 2.1B:
The key thematic areas are identified by the surge of terms in citing articles. The evolution of the field is characterized by the appearance and change of various themes over time. The network is stretched over an array of time zones so that nodes of a particular year can only move vertically within their own time zone. Vertical links indicate incidents of citation and/or co-citation within the same year. Articles that are cited by the hot terms appear to the left of the terms as if they are trails of the evolving themes. The terms suggest the nature of evolving themes. The substance of each theme can be instantiated by the articles associated with these terms, i.e. connected by direct lines. - Image 2.1B: The
forefront (thematic terms) and the knowledge base (cited references)
across time zones showing the major milestones of the evolution of the
field in terms of its contemporary interest.
- Insight 2.2:
The earliest theme associated with information visualization was from the ‘user interface’ perspective in 1986. The perspective is linked to a less frequently occurred term ‘presentation tool’ (not shown in this image). The 1986 fisheye view paper by Furnas and Tufte’s book were among the pioneers. The thematic interest of ‘algorithm animation’ surged in 1989. In 1991, a few papers, notably Robertson et al.’s cone tree paper, were published and subsequently became highly cited. The dominant themes in 1992 included ‘information retrieval’ and ‘dynamic queries.’ Labels of ‘Johnson’ and ‘Shneiderman’ suggest their treemap papers. ‘Data mining’ was a hot topic in 1996 in association with two papers: one is Robertson’s 1993 conetree paper and the other is Lamping et al.’s hyperbolic view paper. An easy way to trace the cited references from a term is to use the free-zone view shown in Image 1.1, for example, ‘graph drawing’ papers typically point to a Munzner paper and a Carpendale paper (See image 1.1).
TASK 3: The people in InfoVis
Task 3.1: Where does a particular author/researcher fit within the research areas defined in task 2?
- Process:
Only partially addressed. See above images. If authors are connected to thematic terms, then their area can be inferred. Robertson, G. G. and Furnas, G. W. are the most prominent authors. It is not immediately apparent what distinguishes them, but based on the fact that Lamping et al.’s hyperbolic view paper is between them, one hypothesize is that Robertson et al.’s conetree is the symbol of non-distorted displays, whereas Furnas’es fisheye view is the symbol of distorted views.
Task 3.2: What, if any, are the relationships between two or more or all researchers?
- Process: Term-to-article citations and article-with-article co-citations.
- Image 3.2: The hypertext cluster, co-cited with the fisheye paper of Furnas
(See Image 1.1, just above the term ‘large databases’ in the
image).
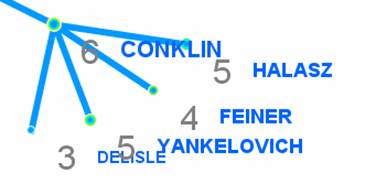
- Insight 3.2:
There was a ‘pre-historic’ cluster of hypertext papers that were highly associated with the fisheye view paper. Conklin’s hypertext survey paper is a branching point leading to several other classic hypertext papers. This is clearly a hypertext cluster.
OTHER TASKS (optional)
None.
COMMENTS (optional)
None.