Contest webpage: http://project.cis.drexel.edu/infovis/
Authors and Affiliations:
- Xia Lin, Drexel University, xlin@drexel.edu
- Jan Buzydlowski, Drexel University, sg81qbdh@drexel.edu
- Howard D. White, Drexel University, whitehd@drexel.edu
Tool(s):
This application is created based on tools we developed for our previous applications AuthorMap (formerly AUthorLink) and ConceptLink . The tools include a set of customized indexing and mapping programs, and a set of Java servlets and applets. The base visualization algorithms implemented include Kohonen's Self-Organizing Feature Maps (SOMs) and PathFinder Networks (PFNETs). A key feature of our system is the coupling of interactivity with instant mapping. Users can browse through lists of authors, keywords, or documents to request on-the-fly mapping and visualization. They can also interact with graphical displays to request new mapping and visualization. The process has been tested with very large databases (both AuthorMap and ConceptLink have been applied to mulimillion-record databases). Another key feature, implemented here for the first time, is cross-mapping. For an author, for example, users can view an author co-citation map, a keyword co-occurrence map, and a document co-citation map.
TASK 1: Static Overview of 10 years of Infovis
- Process:
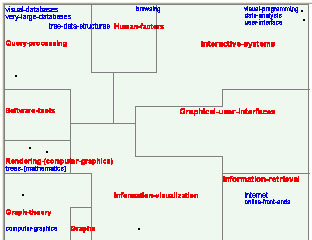
Keywords of all the 615 documents were ranked based on their occurrence frequencies. The top 300 keywords were selected as "dimensions" to train a 14 by 14 Kohonen's Self-Organizing Map. The training matrix consists of the document vectors of 300 dimensions where each value is a 1 if a term is present in the document and 0 if not. the depending on whether the corresponding keyword is appeared in the document or not. After the training process, keywords and documents were mapped to the display. The resulting map shows strong semantic relationships of keywords and documents. The map can be viewed interactively. Two sliders control the number of keywords and documents to be shown.
- Image 1.1 : Overview of the Field of Information Visualization
- Insight:
The overview shows four "poles" of the field: Technology, Theory, Interaction, and Content. All the keywords are organized on the basis of their semantic relationships within the constraint of the four poles of information visualization. The relationships are revealed through keyword regions as well as their sizes and neighborhood relationships. The larger the region, the more documents are related to the corresponding keyword. The closer the two regions, the more documents are related to the two corresponding keywords. Keywords strongly related in the literature are often mapped within the same region.
- Caption for exhibit:
Technology, Theory, Interaction, and Content: The Overview of the Inter-related Research Areas within the Field of Information Visualization
TASK 2: Characterize the research areas and their evolution
- Process:
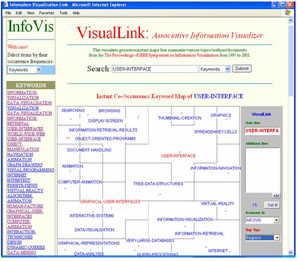
The original data set was read and manipulated using Python to generate several tables of occurrence and co-occurrences of attributes such as keywords, authors, cited authors, and cited references. Each attribute was considered an "information space" for the document collection. Each "information space" was indexed to allow instant mapping of any individual item with the 25 most closely related items within the space or across multiple spaces. The mapping algorithms are Kohonen feature maps, PathFinder Networks, and our own Pennant semantic clustering algorithm. The interface is completed with a series of Java servelts and applets. In the following example, the user first selects the KEYWORDS attribute. After browsing though the keyword list, the user selects "User-Interface" for mapping. He/she then can view three different graphics: regions (Kohonen mapping), links (PFNET mapping) and Pennants (Pennant clustering, to be described in the forth coming paper). The image below shows a PFNET mapping result of the keyword map for "User Interface."
- Image 2.1: A Map of "User Interface"
- Insight 2. Differences between "Browsing" and "Navigation":
Because this data set is small, we did not do an analysis by years. Instead, we focus on the analysis of semantic relationships of concepts. We want to identify differences among similar concepts by comparing their maps. For example, how were "Browsing" and "Navigation" studied in this field? The two seem to be very similar concepts. However, the keyword maps of them have substantial differences, as Image 2.2 shows.
One can easily tell that "Browsing" is closely associated with "Information Retrieal," "Document Handling", and "Searching." "Navigation" is connected to "Information Retrieval" in the context of "Animation" and "Virtual Reality." While "Interactive Systems" is the largest area of the "Browsing" map, "Navigation" forms the largest area in the "Navigation" map. Major terms in the "Browsing " map but not in the "Navigation" map include: "Human Factors," "Indexing," and "Searching." Major terms in the "Navigation" map but not in the "Browsing" map include: "Maps," "Viewpoint-Movement," "Geographic-Context," "Telecommunication-Traffic," etc. A big surprise perhaps is that "Browsing" does not appear in the "Navigation" map and "Navigation" does not appear in the "Browsing" map. This suggests a gap between research on "Browsing" and on "Navigation." It seems that there is no research (that are covered in this data set) on "browsing-based navigation" or "navigation-supported browsing," both are important issues that need to be addressed.
- Image 2.2: Comparing Concepts through Concept Maps
- Insight 2.2:
There are many ways to compare two concepts visually. Image 2.3 gives citation maps of "browsing" and "navigation." The maps show top 25 citations that appear most often with either. One can walk through the maps interactively to see how the two are different.
- Image 2.3: Comparing Concepts through Citation Maps

TASK 3: The people in InfoVis
Task 3.1: Where does a particular author/researcher fit within the research areas defined in task 2?
- Process:
Author co-citation analysis is a method that has been used to identify intellectual relationships of authors and domains. Each co-citation count can be considered as a "vote" on the relationship between two authors. If there are only one or two "votes," the relationship might not be significant; if there are many "votes," the two authors are likely to have some common intellectual interest. When a group of authors' co-citation counts are jointly considered, complex relationships will result and visualization is needed to show the relationships. Such relationships will often show not only how individual authors, but also how author groups and the subject domains they represent are related to each other.
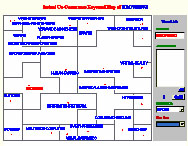
The data set includes 7468 citations, Among them, 3765 have ACM IDs, which are needed to parse cited authors correctly. In this system, we use only those first authors of the 3765 citations to create a small author co-citation database. Even in such a small database, author relationships are shown clearly on the maps we generated.
- Image 3.1.1: Maps of Robertson
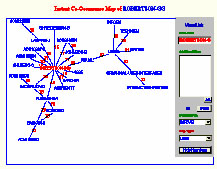
- Insight:
In this example, five maps were generated for George Robertson. Map 1 mixes all the attributes such as authors, keywords and documents in the same map. Two clusters are formed on this map. One is the cluster of "Robertson," and the other is the cluster of "User." It is interesting to see that the two clusters are linked through the stem concept "Visual." Map 2 is a PFNET mapping of authors co-cited most often with Robertson. Robertson is shown as a star in the center, indicating his dominant position in the field. Map 3 is the same map in Kohonen format. This map shows many small clusters, such as "Shneiderman-B" and "Johnson-B", or "Becker-RA" and "Eick-SG." This map is particularly good for resolving ambiguity. For example, "Robertson-G" and "Robertson-GG" are automatically mapped together, as are "Tufte-E" and "Tufte-ER." Maps 4 and 5 show documents that are co-cited most often with Robertson. These maps are best viewed interactively since the titles of each document will pop up only when the mouse is over the corresponding ACM IDs. The two most cited documents in this map (and in this collection) are Robertson's cone Trees article (ACM10883) and Furnas' Fisheye View article (ACM 22343). The map also show how other highly cited documents are related.
There are many interactive functions implemented. When viewing any of these maps, users can click on any display item to start another mapping process, or switch from one type of map display to the other, or switch from an author map to a keyword map to a document map, etc. Collectively, these maps give users new insights that any individual map might not be able to show.
- Image 3.1.2: Maps of Stuart Card
- Insight:
Since the visualizer can generate maps for any author in the dataset, many more maps can be provided. Here is another set of maps for Stuart Card. The analysis and displays were similar to the maps of Robertson. Map 1 is the all-term map with keywords, authors, and documents. Three of Card's publications are highlighted around his name: ACM300826 ("Using Vision to think ..."), ACM238446 ("The WebBook and Web Forager ..."), and ACM857632 ("The structure of Information Visualization ..."). Map 2 is a display of keywords that are occurred most often in articles that cite Card's work. This map can be considered as an overview of research areas to which Card has contributed. Map 3 is a citation map of documents that are co-cited most often with Card's publications. Maps 4 and 5 reveal authors who are co-cited most often with Card, with one modification -- Robertson has been removed from the map. The system is designed to allow the user to remove some items from the display and regenerate the maps. This function is useful in differentiating two items that are very similar. In this case, as Card and Robertson have been co-authors and have been co-cited very often, by removing Robertson from the map, we can have a better view of how other authors are related to Card.
Task 3.2: What, if any, are the relationships between two or more or all researchers?
OTHER TASKS (optional)
NONE
COMMENTS (optional)
A major goal of this system is to visualize semantic relationships through cross-mapping. Given an author, what are the most relevant keywords or research areas associated with his or her name? Given a keyword, what authors have most often co-occurred with it? How are they related to each other? Ways of asking these kinds of questions are endless. The best way to answer them is to use an interactive mapping system and let the user control the output by selecting the entry point, the type of indexing terms displayed, the mapping format, and so on.
Our system achieves this through the implementation of instant mapping. Among the available terms to be mapped are authors or cited authors, keywords, and documents. Users can freely choose to map their inquiries either within each indexing space or cross the spaces.
Because our semantic relationships are "abstracted" from simple statistical co-occurrence counts or co-citation counts, the larger the data set, the more robust the semantic relationships will be. For this purpose, the INFOVIS data set is too small. The capability shown here would be better applied to much larger data sets, such as all the literature in the ACM digital library, or all the documents in sciences or social sciences.
To test the system interactively, please visit:
Associative Information Visualizer
Login with user "test" and password "test".
Web Accessibility